UPFINA's Mission: The pursuit of truth in finance and economics to form an unbiased view of current events in order to understand human action, its causes and effects. Read about us and our mission here.
Reading Time: 4 minutes
The latest PCE report from April completed a couple recoveries and almost completed another. When it comes to compensation, spending, and inflation, the pandemic losses have been all but recuperated. Remember, the people who are able to work from home get paid the most. They have an outsized impact on compensation and spending. Clearly, the bottom third of the labor market hasn’t fully recovered. The hardest hit areas of the economy haven’t recovered and neither has the entire labor market.
Specifically, compensation is 0.2% above the trend it was running at prior to the pandemic. Real personal consumption is still 1% below the trend. Finally, as you can see from the chart below, the core PCE price index is 0.2% above the 2% trend growth rate it was running at prior to the pandemic.
Obviously, this opens the Fed up to questioning about its current dovish monetary policy. The entire premise of its new framework is for core PCE inflation to make up for prior years of weakness. If it has made up for its below trend growth rate, there is more pressure to turn hawkish. Luckily, the market has been pricing in hikes before they will likely occur. If the Fed were to end QE and hike rates quicker than it has said, it wouldn’t concern markets much.
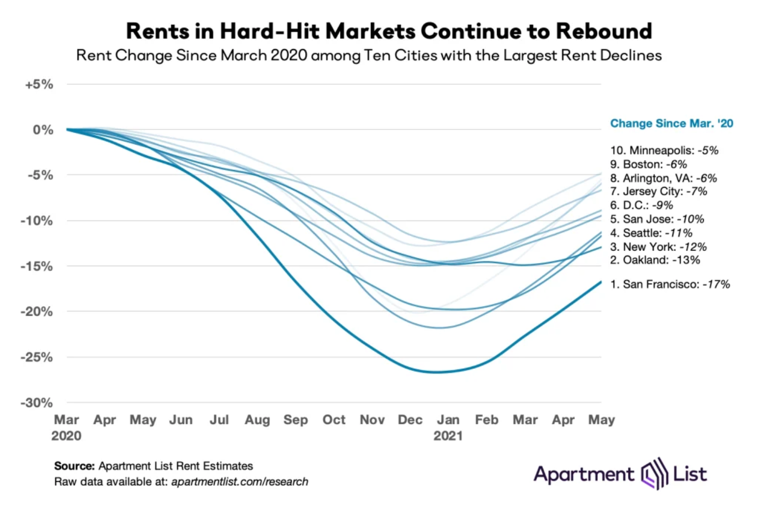
Rents Are Recovering
Cities are recovering. There is no longer a need to leave the city since the vaccines have stopped the spread of the pandemic. We are within a couple months of people returning to offices and restarting the much-dreaded work commute via public transportation. As we predicted, rent prices are improving as well. This is going to be a huge driver of core CPI in the summer.
As you can see from the chart below, as of May, the hardest hit markets have all recovered from their troughs in late 2020/early 2021. In fact, rents in New York are only down 12% from March 2020. The comps will be extremely easy this summer, meaning yearly shelter inflation will be very high. As we mentioned in a prior article, 5 small categories drove most of the core PCE expansion in April.
Obviously, shelter is a huge component of inflation. The Fed won’t be able to say small categories drove strong inflation this summer. However, they can still use the transitory argument. If you want to get philosophical, every single economic change is transitory. Nothing lasts forever. This is a great term for the Fed because it’s flexible. It allows the Fed to pursue whatever policy it wants.
Narrative Violation
It’s always fun to look at data that counteracts the prevailing narratives on Wall Street and on financial social media. When data differs from prevailing theories, you have the opportunity to generate alpha. Just make sure to avoid obvious chart crimes where the axes and scales are contorted so the chart goes viral (popular). Manipulated data is more likely to go viral than boring facts, but boring facts are more likely to make you money.
As you can see from the chart above, e-commerce as a percentage of US retail sales is only a few quarters ahead of its previous trend. Some have made the wrong claim that online penetration is a decade ahead of the previous trend. This isn’t necessarily a disaster for e-commerce investments. This chart shows there is less downside risk for e-commerce’s market share. Of course, the decline may have already occurred. It doesn’t need to perfectly follow the prior trend.
Specifically, in 2020 e-commerce’s share of overall retail sales in America was 19%. The highest was in South Korea (40%). Second place was China which had 28% share. On the opposite side, e-commerce only had 6% share in India. That’s a big growth market obviously. India is set to be the largest country in the world soon.
No One Wants A Vehicle
In a prior article, we explained that consumers soured on buying houses and cars in May because of price increases. A common phrase among home buyers is “I know I overpaid.” Technically, they might not have overpaid. Affordability still isn’t out of control. This is the opposite of a bubble. Banks have not made it easy to get a mortgage. However, people feel they overpaid because there is a mad dash to buy houses above asking prices.
The situation for vehicles is similar to housing. As you can see from the chart above, the vehicle buying conditions index is near the trough in the 2007-2009 financial crisis. The chip shortage has lowered the supply of new cars. Demand increased once people decided it wasn’t safe to use public transportation. It also helped that flying became unsafe.
Even though the pandemic is nearly over, people haven’t given up their cars yet. If people in cities drive at a higher rate than before the pandemic, there will be massive traffic jams. The Manheim used car index in May is up 48% from last year. Both used and new car affordability and supply are challenged. Demand might finally pullback this summer due to elevated prices.
Conclusion
The core PCE prices index recovered all its pandemic losses. The Fed is likely going to be more hawkish in its remaining meetings this year, but we believe rate hikes aren’t likely. It will simply guide for the end of QE next year. Rent is set to drive core inflation up this summer. Online retail penetration is a few quarters (not a decade) above the prior trend. Vehicle buying conditions are extremely challenged because of the spike in prices. Maybe demand for used vehicles will finally pullback this summer.
Have comments? Join the conversation on Twitter.
Disclaimer: The content on this site is for general informational and entertainment purposes only and should not be construed as financial advice. You agree that any decision you make will be based upon an independent investigation by a certified professional. Please read full disclaimer and privacy policy before reading any of our content.


