UPFINA's Mission: The pursuit of truth in finance and economics to form an unbiased view of current events in order to understand human action, its causes and effects. Read about us and our mission here.
Reading Time: 4 minutes
The U.S. economy is becoming less cyclical which means it needs a greater decline in its cyclical part to generate a recession. The fact that the U.S. consumer has deleveraged in this cycle is probably the most important reason the economy is in its longest expansion since the 1800s. The secondary reason is the rise of acylical sectors like healthcare. These healthcare jobs are replacing the old manufacturing jobs of previous decades. This is a big shift since manufacturing is extremely cyclical. There have already been two manufacturing slowdowns in this expansion (we’re in the 2nd one now).
If the U.S. labor market relied more on the oil and gas industry, there would have been a recession in 2016. Interestingly, even though the US is producing the most oil and gas ever, the industry doesn’t employ as many workers as it did in the 1980s. As of September, the industry employed 161,300 workers. The peak was 200,800 in 2014 which is still way less than 1% of the labor market. That’s nothing compared to the peak in 1982 at 267,000 when the overall labor market was much smaller. Fracking doesn’t require that many workers. The whole industry has gotten much more efficient just like in all of manufacturing.
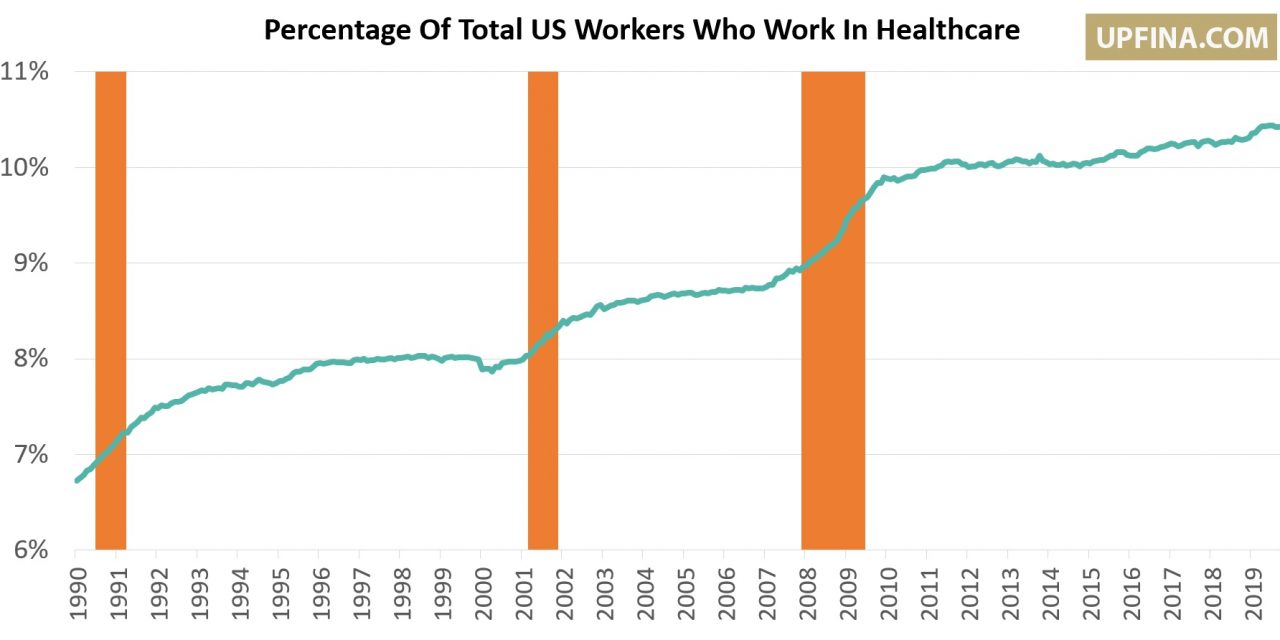
Healthcare is going in the opposite direction because of aging demographics. As you can see from the chart below, in 1990, 6.7% of American workers were in healthcare and now the percentage is 10.4%.
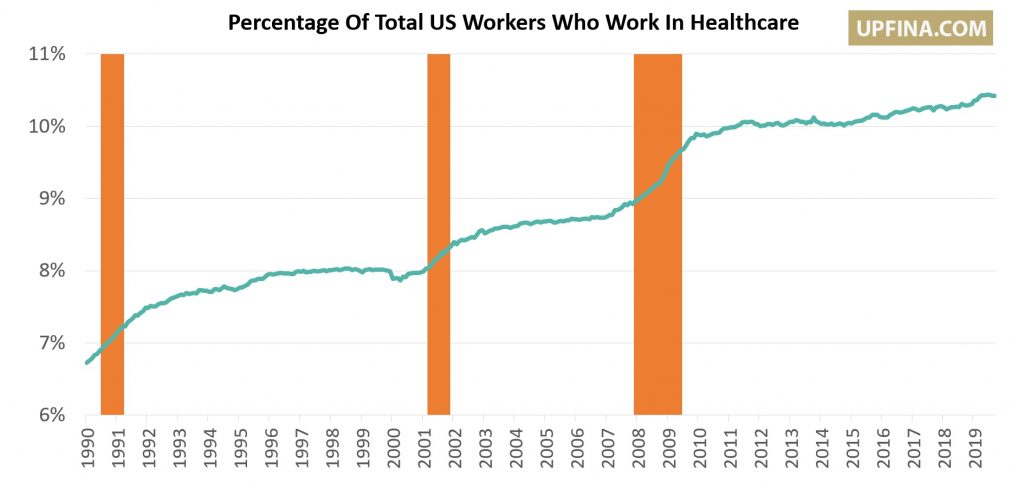
You can tell healthcare isn’t cyclical because its percentage of the labor market increases during recessions. The orange bars are recessions. It rarely has given back any gains in the past 29 years. With healthcare being so important, it helps stabilize the labor market in cyclical slowdowns.
Philly Fed Index Shows Improved Optimism
Because of the trade war, we’ve seen soft data surveys come in much worse than the hard data. The soft data shows a coming recession, while the hard data shows a regular slowdown. This situation wasn’t the case in the Philly Fed manufacturing report considering the fact that the hard data September industrial production report showed the first yearly decline in industrial production since November 2016. The October Philly Fed general business conditions index fell from 12 to 5.6 (missed estimates for 7.1). The new orders index rose 1.4 points to 26.2 and the shipments index fell 7.5 points to 18.9. The optimism we spoke of was in expectations.
Despite any lingering worries about the trade negotiations with China, the 6 month expectations index rose from 20.8 to 33.8. New orders and shipments rose 4.7 and 1.6 points to 39.9 and 42.9. As you can see from the chart below, the capex expectations index rose from 25.9 to 36.4. This is one of the best readings in the past 19 years.
Just 5.7% of firms saw a decline in capex coming in 6 months. That’s not in line with the broad based manufacturing slowdown reported in the industrial production report. Maybe industrial production will rebound in October.
Richmond Fed Index Sharply Improves
The Richmond Fed manufacturing index is the 3rd of 5 regional Fed manufacturing reports. This one showed the most improvement as the index went from -9 to 8. This beat the high end of the estimate range which was -5. No one saw such an improvement coming. Why would they, given the cyclical weakness and ongoing trade war?
There was a major reversal as both volume of new orders and shipments went from -14 to 7 and 4. The local business conditions index improved from -15 to 4. There is no expectations index, but it would have increased if it had the same weightings as the general index. New orders and shipments increased 11 and 9 points to 33 and 24. As you can see from the chart below, the average of the regional Fed reports sees an ISM PMI of about 53 which would be a big bounce back from its last reading of 47.8.
September Starts & Permits Fall
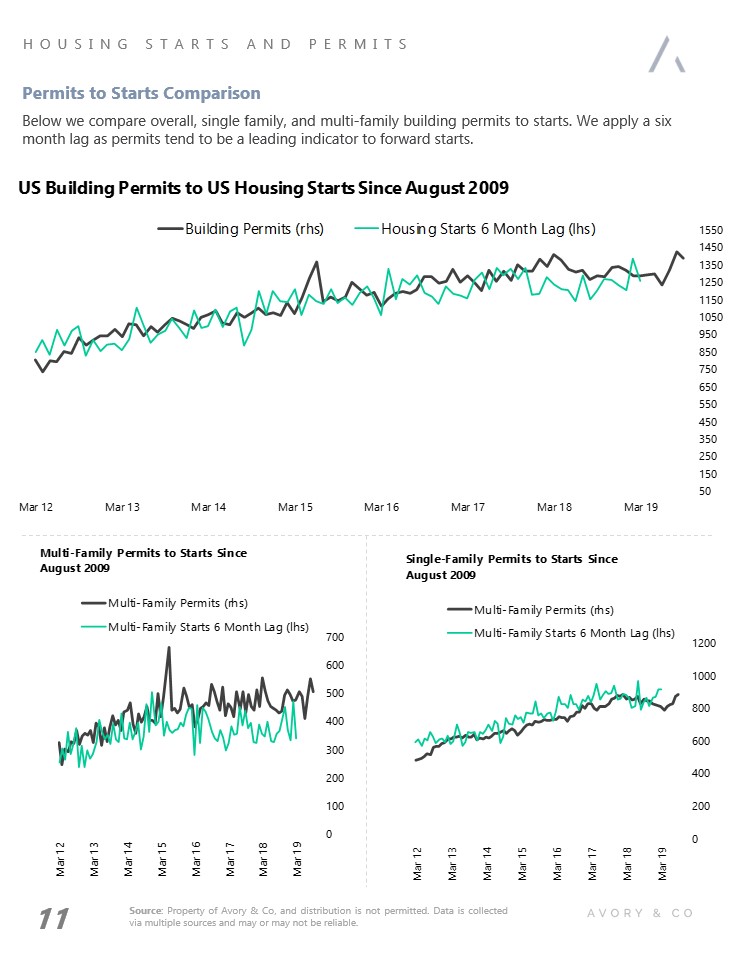
September housing starts were 1.256 million which is down from 1.386 million. This missed estimates for 1.3 million. Even so, starts were still up 1.6% from last year. Starts fell 9.4% from the previous month because August had fantastic monthly growth of 15%. Single family starts were up 0.3% monthly (5th straight increase) and 4.3% yearly. Single family starts pack a more powerful punch than multi-family starts in the GDP report. Multi-family starts were down 28.2% monthly and 5.1% yearly.
Permits fell from 1.425 million to 1.387 million which beat estimates for 1.335 million. They were up 7.7% yearly. Single family permits were up 0.8% monthly and 2.8% yearly. Multi-family permits were down 8.2% monthly, but up 17.4% yearly. As you can see from the chart below, housing starts are correlated with permits pushed forward by 6 months. This implies starts will continue to improve modestly later this year and into next year. Housing is being helped by low interest rates and solid real income growth. If either of those change, we could see it reverse course harder than it did in the 2nd half of 2018.
Housing completions were down 9.8% monthly and 1% yearly. That’s growth of -8.6% and 1.8% for single family homes and -10.9% and -6.3% for multi-family homes. Looking at the regional data, the Northeast was a bloodbath for starts, but the strongest area for permits; its yearly growth rates in those two categories were -22.1% and 11.9%. The South, which is the largest housing market, had strength in both categories as its growth rates were 18.6% and 8%.
Conclusion
We’ve been looking at the increasing size of the acylical economy potentially acting as a cushion for the current cyclical weakness and preventing a recession. The regional Fed manufacturing reports imply the manufacturing ISM will rise above 50 again which would be big news. It would probably send stocks higher, depending on where the consensus is. The ISM report comes out on November 1st. Housing starts and permits weren’t great, but the trend of a modestly strengthening housing market because of low rates and positive real income growth is still in place.
Have comments? Join the conversation on Twitter.
Disclaimer: The content on this site is for general informational and entertainment purposes only and should not be construed as financial advice. You agree that any decision you make will be based upon an independent investigation by a certified professional. Please read full disclaimer and privacy policy before reading any of our content.


