UPFINA's Mission: The pursuit of truth in finance and economics to form an unbiased view of current events in order to understand human action, its causes and effects. Read about us and our mission here.
Reading Time: 4 minutes
We didn’t mention the quits rate in our discussion of the JOLTS report in our last article. That’s because the seasonally adjusted rate stayed at 2.4% in March. That matched the historical peak in this reading. The data series started in December 2000. 2.4% has been hit 9 times. 4 of those readings have been hit in this cycle already even though it’s less than a year old (as of March). This reading seems boring, but that’s not entirely true.
The quits to total separations rate hit a record high as you can see from the chart above. This makes sense because we have been seeing such few layoffs. The Challenger report showed there were the least job cut announcements since June 2000 (in April) which is before the data on quits started. Employees now have a lot of leverage. Employers need to keep raising salaries to avoid talent fleeing the company. There is a tight labor market in many industries. The pandemic has risen the full unemployment rate temporarily.
Is The $300 The Problem?
One of the hottest discussion topics on the labor market is why more jobs aren’t being created considering the record level of job openings. It has become political because some consider the people on unemployment claims “lazy.” $300 per week isn’t enough to live off though. If they are being lazy, they aren’t being rewarded for it. When the federal government was giving people $600 per week, it rewarded not working. However, that was during the worst of the initial phase of the pandemic which is why it didn’t create many unintended consequences.
30% of restauranteurs and retailers believe the $300 in supplemental benefits are why they are having trouble finding workers. The truth is it’s a combination of all the answers listed. If people are getting money from the government, they can afford to be pickier with where they work. They have higher bargaining power.
Furthermore, if they fear catching COVID-19 or can’t afford daycare, workers will stay on unemployment longer when they receive more benefits. The math would change if they weren’t getting the extra $300 (and the stimulus checks). Even though this is a hot topic now, it’s not worth getting worked up about because its temporary.
The weekly benefits will expire in September. The pandemic will end before then in the US. In the past 2 weeks, the 7 day average of new cases has fallen from 52,671 to 38,135. A couple weeks ago, America reached the vaccination rate Israel reached right before its cases fell dramatically. The 7 day average of deaths in Israel has been 2 or lower for the past 2.5 weeks.
Updated Review of Household Debt
Let’s look at the Q1 NY Fed Household Debt and Credit report to get a better look at the consumer’s balance sheet. We know consumers are spending a lot of money. The Redbook weekly same store sales reading in the week of May 8th fell from 14.2% to 13.3% which is still very strong. Non-housing debt fell $20 billion to $4.15 trillion. Housing debt rose $100 billion to $10.49 trillion which is a new record high. It’s amazing that it’s only $500 billion higher than the peak in 2008. That’s only about 5% growth in 12.5 years. Growth is probably going to continue steadily in the next couple years as millennials buy houses.
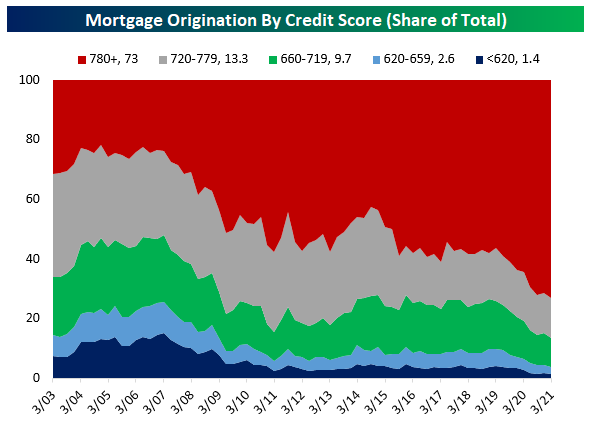
This rise in housing debt is nothing like the bubble in the 2000s. In fact, many lenders have pulled back on mortgage lending since the pandemic started. As you can see from the chart below, the share of mortgages with a credit score at or above 780 has spiked to 73%. Almost no one with a score below 660 is getting a mortgage. People are coming in with cash to buy houses. They are selling like hotcakes. There is a shortage of housing which will eventually work its way out of the system when prices rise enough.
Technically, with CPI above the 30 year mortgage rate, borrowers are getting a negative real rate. However, CPI won’t stay this high for more than a few months. That’s what the bond market believes. If the bond market is wrong or if the Fed is suppressing yields, mortgage borrowers are getting a fantastic deal. Unfortunately, that comes along with more expensive housing.
Now let’s look at the health of the debt on the books of household’s balance sheets. The mortgage delinquency rate is still very low. The credit card delinquency rate is spiking even though consumers have a lot of cash. The percent of balances that are 90+ days delinquent increased from 9.4% to 10% which is the highest reading since Q2 2013. The delinquency rate on student loans has fallen in the past few quarters because loans have been put in forbearance. The 90+ day delinquency rate has fallen from 11.1% in Q4 2019 to 6.2% in Q1 2021.
The chart below shows newly delinquent loans have all been cratering. It’s hard to go delinquent when there are stimulus programs, jobless benefits, high wages and forbearance programs. Usually, the data gets better in expansions, but these rates should all increase in 2022 as the pandemic help goes away.
Income Inequality Explained
There is a big gap between high and average performers in very highly complex jobs. This makes sense because if the job is complex, even people who are qualified might not be good at it. Think of the difference in skill between world class athletes and the average player. If the all-stars played the average players, the score wouldn’t be close. This explains why highly skilled workers get paid so much. There is a low supply of high performers in very complex fields.
Conclusion
The labor market is tight even though the unemployment rate is high. This is the impact of the pandemic and stimulus measures. The spike in the housing market is mainly due to buyers with very high credit scores. There aren’t many newly delinquent loans because of stimulus and forbearance programs. Highly complex jobs pay workers a lot because there aren’t that many high performers in these fields.
Have comments? Join the conversation on Twitter.
Disclaimer: The content on this site is for general informational and entertainment purposes only and should not be construed as financial advice. You agree that any decision you make will be based upon an independent investigation by a certified professional. Please read full disclaimer and privacy policy before reading any of our content.


