UPFINA's Mission: The pursuit of truth in finance and economics to form an unbiased view of current events in order to understand human action, its causes and effects. Read about us and our mission here.
Reading Time: 5 minutes
What Is Price To Earnings Ratio – PE Ratio?
The most common valuation metric for stocks is the price to earnings ratio, otherwise known as the PE ratio. You calculate it by dividing the price of the stock by the yearly earnings per share. For example, a PE multiple of 10 would occur if the stock had a price of $10 and $1 in yearly earnings per share (EPS). Each quarterly report is important because the latest EPS number is released and firms often give forward earnings guidance.
In theory, the PE ratio allows you to compare all stocks with each other. You’ll quickly find out that you need more information to compare companies such as the sustainability of their competitive advantage, sensitivity to the economy, and projected earnings growth rate. Some of that is determined by the sector and industry the company is in. To be clear, sectors are bigger than industries. An example of a sector is technology and an example of an industry is semiconductors.
Trailing Versus Forward Price to Earnings Ratio
The two types of price-to-earnings multiples are the trailing PE ratio and the forward PE ratio . The trailing PE multiple uses the last 12 months of earnings. Those results are established because they have already been reported. However, if the future is expected to be much different than the past, they are useless.
The forward PE multiple includes earnings-per-share (EPS) expectations for the next 12 months. You can include whatever EPS number you think will occur. It can be your own estimate, the highest analyst estimate, the lowest analyst estimate, or the consensus estimate. The high and low estimates can give you a general range of where the valuation might be. Forward PE multiples measure what is important, namely the future. However, because they are estimates, they aren’t established like trailing earnings. Estimates can be wildly off due to changes in the economy, increased competition, or poor execution.
Best Way To Use PE Ratios
Besides comparing stocks to each other, you can compare a firm’s valuation to its historical past. You can look a firm’s historical trailing and forward earnings ratio to get an idea of whether it is cheap or expensive. Typically, the media likes to say a stock is cheap if it has a low PE and expensive if it has a high PE. That’s sloppy language in our opinion. We think a stock is cheap when it is trading below its intrinsic value and expensive when it is above that valuation. A ‘value trap’ is when a company that has a low PE multiple isn’t a great stock to own. There technically are no traps to buying value if the value is really there.
What Is A PE Ratio Really?
The mainstream media fundamentally misinterprets what a PE ratio represents. The reason they are wrong is because they treat earnings as a constant. If earnings are static, stock prices vacillate because of multiple changes. In that case you should buy firms with the lowest ratio. The reality is multiples represent how valuable earnings are. If a company has an extremely stable business with a high moat, earnings will be more valuable. The value of earnings is all about the confidence in the business model. This confidence can be affected by competition, regulations, scale, the firm’s balance sheet, and its product pipeline.
Facebook’s ability to easily fend off Snapchat makes investors value its earnings more because competition isn’t a problem. However, the risk of fines and regulations undermines confidence in the firm’s future earnings. Historically, we’ve seen Alphabet have a higher multiple than Apple because it’s easier to get people to stick with Google than it is to keep selling them $1,000 smartphones. That’s why Apple’s services business is so important. It provides consistent sales.
The fact that you can still make money properly identifying which business has the potential to retain its customers and increase its sales per user or grow its customer base should make you feel more confident in your ability to be a solid investor. It’s not all about who is first to a trade based on news flow.
How Else To Use PE Ratios?
Besides valuing individual companies, investors also value stock market indexes which are groups of companies investors buy to diversify. Investors compare country indexes to their historical valuation and other countries’ indexes. For example, you can look at the historical S&P 500’s forward PE multiple and compare it to the DAX which is a German stock market index.
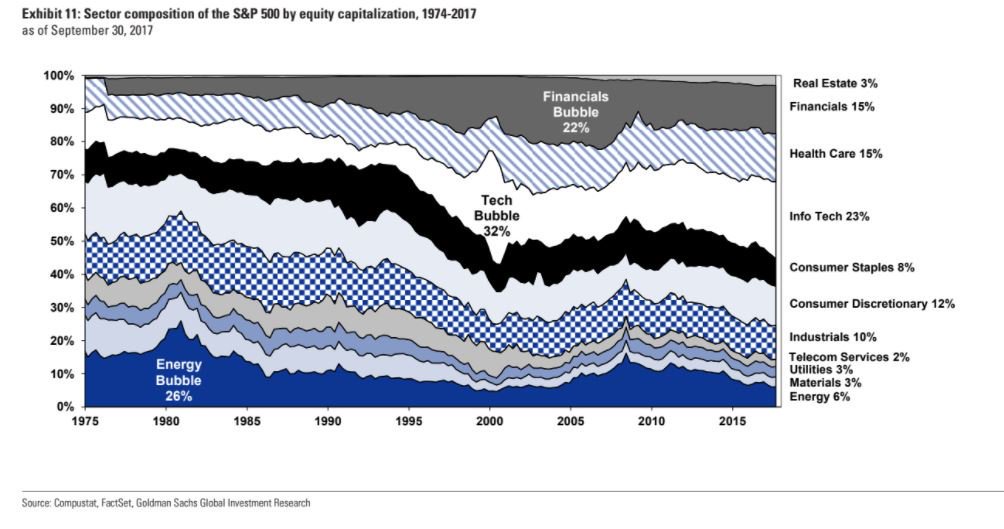
The big mistake investors make is ignoring the makeup of the indexes. The entire point of an index is to capture a wide swath of companies, but the companies in the index change over time and the relative weighting varies depending on the country. As you can see from the chart below, the weightings within the S&P 500 have changed.
The S&P 500 you are buying today doesn’t look like the S&P 500 did in 1983 when it had a high exposure to energy. It’s worth noting that the tech sector has a high international exposure. When tech increases its weighting, the S&P 500 becomes more exposed to the global economy.
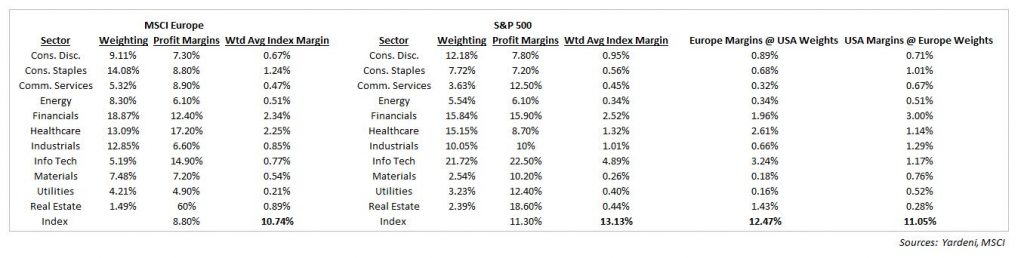
You can’t directly compare the PE multiple of the S&P 500 with that of MSCI Europe because each index has different sector weightings and its earnings projections are different. As you can see from the table below, the financials are the biggest sector in Europe and tech is the largest sector in America. If you don’t like financials and want to invest in the MSCI Europe index, then you should consider betting against the European banks. Because tech firms grow their earnings quickly, the sector has a high PE multiple which explains why the US market trades at a premium to Europe.
Price To Earnings Growth Ratio – PEG Ratio
As we have hinted at, the PE ratio is dependent on future earnings growth. It makes sense to pay more for current earnings if earnings in the next 5 years project to be much higher. Investors take growth into account with the price to earnings growth ratio, otherwise known as the PEG ratio, which is the PE ratio divided by growth. Usually, high growth companies have higher multiples than low growth companies, but they might have lower PEG ratios because investors aren’t confident in the growth. Low growth companies’ multiples are boosted if they pay a dividend because their yield is compared to treasuries. They become bond-like securities. There’s no rule what the PEG ratio should be. It’s all dependent on how confident you are in the company’s ability to grow.
Conclusion
We gave you the definition and formulas for the price to earnings (PE) and price to earnings growth (PEG) ratios. Compare the company’s PE and PEG ratios to its competitors and industry average. The key takeaway from this article is a stock’s earnings multiple depends on investors’ confidence in the company and its potential. It’s best to buy companies at a reasonable price that have a strong moat and room to grow. You can also buy very cheap companies with less than stellar fundamentals. It’s all a balancing act.
Have comments? Join the conversation on Twitter.
Disclaimer: The content on this site is for general informational and entertainment purposes only and should not be construed as financial advice. You agree that any decision you make will be based upon an independent investigation by a certified professional. Please read full disclaimer and privacy policy before reading any of our content.


