UPFINA's Mission: The pursuit of truth in finance and economics to form an unbiased view of current events in order to understand human action, its causes and effects. Read about us and our mission here.
Reading Time: 4 minutes
The Bank of America fund manager survey was done from September 6th to the 12 which was during the selloff in treasuries and the rally in value versus growth. As you can see from the chart below, as treasuries were selling off, they were considered the most crowded trade. To be fair, long treasuries was also considered crowded in August. Managers didn’t say it was crowded because the trade unwound.
This survey gave you a hint a big reversal was coming in August as over 30% of fund managers stated this was the most crowded trade. During the selloff in treasuries last week, the survey showed that percentage getting near 40.
Similarly, this survey showed long growth stocks was a crowded trade and there was a big pop in the ratio of value to growth stocks as the financials and energy sectors rallied in the first half of September. Obviously, it’s way easier to point out an overcrowded trade than it is to get in the trenches and bet against it because betting against a trend takes great timing. If you mistime the trade, you can lose money. It’s easier to do from the sidelines. That’s not to say there’s no value in avoiding overcrowded trades. Just staying out of the way can be a big win. Timing is less of an issue here.
Expecting A Trade Deal Is Non-Consensus
The latest news on trade appears to be positive as China and America will meet in mid-October. One potential negative not covered in the media is that China may have exempted tariffs on pork and soybeans because food prices are soaring not because of goodwill. It’s debatable if that’s good or bad because on the one hand, it means China isn’t changing its stance on trade. On the other hand, did we really expect China to change its perspective out of kindness? It’s all about economics.
Fund managers aren’t optimistic on trade, making the expectation of a deal a non-consensus play. You have the opportunity to make money if you are correct on this. To outperform the market, you need to go against the consensus at inflection points. However, to go against the consensus successfully, you need really good research. The trade war was considered the biggest tail risk in this survey. However, it fell from getting about 50% of the vote to about 40%. As you can see from the chart above, over 35% of managers think the U.S. China trade war is the new normal which won’t be resolved. Only less than 5% see it being resolved this year. 25% say a deal will be made before the US presidential election in 2020.
Managers Chase US Stocks
Cash levels fell from 5.7% in June to 4.7% in September as managers might be chasing equities. They are chasing US stocks in particular. As you can see in the chart below, allocation to US stocks increased 15 points to a net 17% overweight. That’s the biggest jump since June 2018.
When the net percentage of fund managers overweight US stocks is above 15%, US stocks fall 25.2% annually.
GDP Could Turn Negative
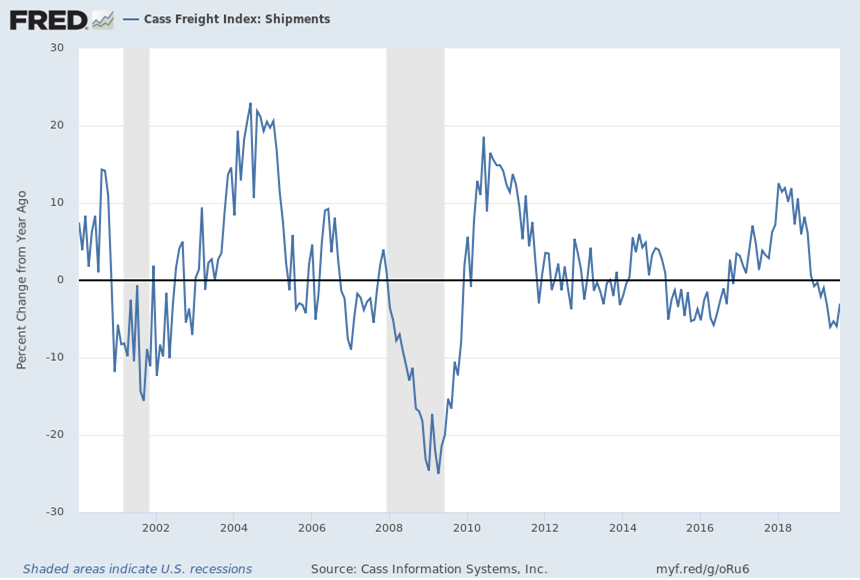
The Cass Freight index was weak again in August. Cass Information Systems stated, “we see a growing risk that GDP will go negative by year’s end.” This is because the shipments index is “signaling an economic contraction.” The results weren’t good even though the shipments index had 1.6% monthly growth. This report isn’t seasonally adjusted so we look closer at yearly growth.
This was the 9th straight negative yearly volume growth reading as the chart below shows.
Yearly growth improved from -5.9% in July to -3%. That improvement only occurred because the comp fell from 10.6% to 6%. In other words, the 2 year growth stack fell. It went from 4% to 2.8%. On the other hand, tough comps make the 6% decline in May, which was the worst in this expansion, look better than it was. The 2 year growth stack isn’t as bad as the 2016 low just yet.
The expenditures index was similarly bad. Its yearly growth rate fell from -1.4% to -2.6% which is the worst reading since December 2016. Its comps are tougher which is why its 2 year growth stack is still very high. However, the 2 year stack is dropping quickly as it went from 27.7% in December to 16.3% in July to 13.6% in August.
Chinese Rhetoric & Expectations Don’t Match PMI
The Chinese Premier signaled more pessimism than the recent PMI report showed. Li Kreqiang stated “For China to maintain growth of 6% or more is very difficult against the current backdrop of a complicated international situation and a relatively high base, and this rate is at the forefront of the world’s leading economies.” He blamed the global slowdown and protectionism (the trade war).
It’s ironic to see China blame the global slowdown since China is one of the main drivers of said slowdown. Morgan Stanley believes 2019 GDP growth will be near the low end of the government’s expected range of 6% to 6.5%. It’s sounds like it’s based on the Premier’s rhetoric. This isn’t in line with the August Caixin PMI which improved from 50.9 to 51.6 because of improvements in services and manufacturing. Services increased from 51.6 to 52.1 and manufacturing from 49.9 to 50.4.
Weak Expectations
The Empire Fed manufacturing report showed big weakness in 6 month expectations. The current index fell from 4.8 to 2 as the new orders and shipments indexes fell 3.2 and 3.5 points to 3.5 and 5.8. The big sequential decline was in expectations as the forward general business conditions index fell 12 points to 13.7. The new orders and shipments indexes fell near their 2016 lows. They fell 9.8 and 10.7 points to 21.9 and 20.4. As you can see from the chart below, the technology spending and capex indexes cratered. They fell 10.9 and 18.6 points to 6.5 and 4.6.
Conclusion
Fund managers were right about treasuries and growth stocks being overcrowded as treasuries have sold off and value has outperformed growth recently. Fund managers have been chasing U.S. equities, but they aren’t optimistic about a trade deal soon. The Cass Freight index shows the level of economic weakness is getting closer to the 2015 to 2016 slowdown. Cass Information Systems already sees the possibility of negative GDP growth later this year. The Empire Fed manufacturing expectations index showed weakness possibly because of the trade war.
Have comments? Join the conversation on Twitter.
Disclaimer: The content on this site is for general informational and entertainment purposes only and should not be construed as financial advice. You agree that any decision you make will be based upon an independent investigation by a certified professional. Please read full disclaimer and privacy policy before reading any of our content.


