UPFINA's Mission: The pursuit of truth in finance and economics to form an unbiased view of current events in order to understand human action, its causes and effects. Read about us and our mission here.
Reading Time: 4 minutes
The chart below is quite spectacular in the sense that a major global research firm is stating ‘other’ drove stocks higher this year.
Just because it has very detailed reactions to each data point and news event doesn’t mean you can’t disagree with it. One important aspect to factor in is that the entire effect of each event and data point isn’t always limited to a set time period. If you as an individual investor or a fund manager have utilized an older release to make a decision on a trade, it proves the market doesn’t perfectly price in data immediately.
It’s notable how the Fed often alters forward guidance through speeches, but this chart shows only a few changes related to Fed news. This chart is a great discussion piece to review how we think each factor affects stocks. It’s a big claim to say the main reason stocks are higher isn’t macroeconomic data, Fed news, trade news, or international news.
Everything Is Interconnected
George Pearkes made the ultimate comment on how stocks are reacting to Fed policy, the trade war, and global economic data. They are all intermingled and very hard to tear apart. He tweeted the following point:
The circular logic comes into play because stocks affect Fed policy and trade policy. If you buy stocks because you’re optimistic about the possibility of a trade deal, you are pushing stocks up which increases the probability of more tariffs being enacted. If you sell stocks because you don’t think the Fed will cut rates, you are pushing stocks lower which makes the Fed more likely to cut rates. Stocks probably haven’t ever been so caught up in a circular scenario like this.
Review Of Chinese Economy
It’s important to keep in mind that the latest détente in the trade war between American and China isn’t a trade deal. The two sides aren’t close to finalizing a deal. The détente means there won’t be any new tariffs, there will be negotiations, Chinese visa students will get better treatment, and American farmers will get supposedly bigger purchases from China.
With that understood, let’s look at the latest Chinese PMI data which isn’t great. As you can see from the chart below, the June manufacturing PMI was 49.4 which missed estimates for 50.1 and fell from 50.2 in May.
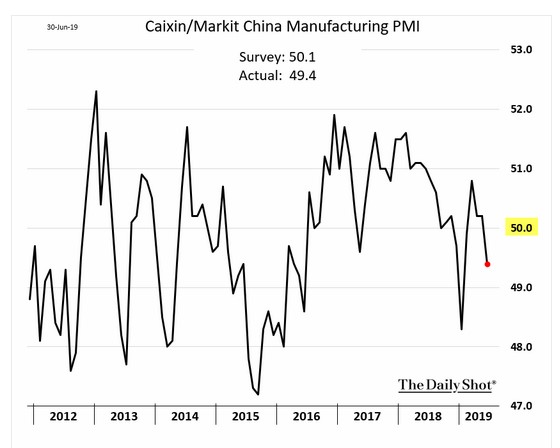
The decline in new work pushed production into contractionary territory for the first time in 4 months.
Goods production output was down slightly. The consumer goods sub sector was the only one to increase production growth. As the chart below shows, Chinese manufacturing firms shed workers. Input cost inflation hit a 7 month high, but was still low. The services PMI was also weak as it fell from 52.7 to 52 in June which was the weakest reading since February. This report pushed the composite index down from to 51.5 to 50.6 which is an 8 month low.
Chinese government policies helped increase client spending which has increased growth in new work. Factory orders have been hurt by trade tensions and services have been helped by fiscal and monetary stimuli. As the chart below shows, services employment fell further into contractionary territory in June.
The composite of businesses future expectations fell to a record low for the 2nd straight month mostly because of manufacturing (expectations were marginally positive) as service sector firms stayed strongly optimistic.
Headline Crime
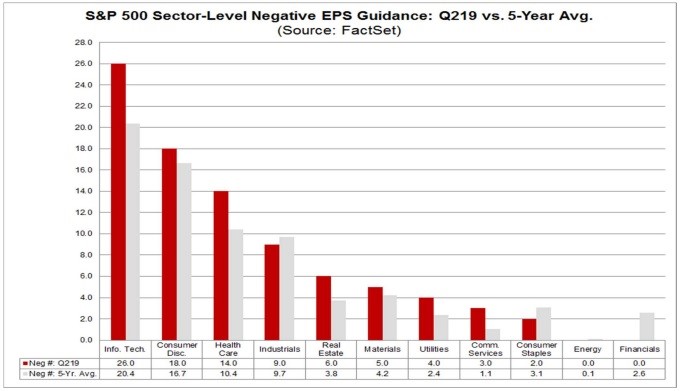
FactSet puts out great data on earnings which we will review here. Obviously, headlines are meant to grab readers’ attention, but we will quickly point out the headline crime which mentions there is a flood of negative earnings pre-announcements. The number is elevated as you can see from the chart below.
87 firms have issued negative guidance and 26 have issued positive guidance. The number of negative pre-announcements is higher than the 5 year average of 74 and it’s the 2nd highest number since 2006. (The highest was 92 in Q1 2016.) The reason we feel this isn’t a flood of negative guidance is about 387 firms didn’t change their guidance. 13 more firms reporting negative guidance than average is the equivalent of a 2.6% increase in firms issuing negative guidance (as a percentage of the S&P 500). Just like how the first 20 firms reporting results is a small data point, this is too.
With that being contextualized, it’s still very important to delve into the numbers to see what’s driving these negative results. 7 of 11 sectors have had more firms issue negative earnings guidance than their 5 year average. Tech usually has the most negative guidance and it is having a relatively poor quarter, so the overall number has increased. To be clear, there were 26 negative tech pre-announcements in Q2 and the average is 20.4. Tech is being hurt by the global growth slowdown. Tech’s total is one behind its highest since 2006. Semiconductor equipment and software firms have had 9 and 6 negative pre-announcements.
The tech sector usually tells us where the overall number would be. If, for example, consumer staples was hit by high commodity prices causing negative guidance changes, it probably wouldn’t have a big impact on the overall total as its average is 3.1. Industrials having 9 negative pre-announcements instead of 9.7 had a small impact on the overall total. The counterpoint here is that tech has a 20.12% weighting in the S&P 500, while industrials are at 9.2% and staples are at 7.42%. (All as of the end of last year.) These are all factors to consider.
Conclusion
Bank of America has ‘other’ driving 2019 stock market performance. We are using this chart as a discussion starter as many will disagree with how each factor affected stocks. The stock market is impacted by trade and monetary policy, but also affects them. The Chinese PMI hit an 8 month low. This weakness was driven by the manufacturing sector. It’s a misnomer to say there is a flood of negative earnings. There were 13 more negative pre-announcements than average.
Have comments? Join the conversation on Twitter.
Disclaimer: The content on this site is for general informational and entertainment purposes only and should not be construed as financial advice. You agree that any decision you make will be based upon an independent investigation by a certified professional. Please read full disclaimer and privacy policy before reading any of our content.


