UPFINA's Mission: The pursuit of truth in finance and economics to form an unbiased view of current events in order to understand human action, its causes and effects. Read about us and our mission here.
Reading Time: 4 minutes
The manufacturing sector is turning around outside of the weakness catalyzed by the coronavirus and the Boeing 737 Max delay. The Empire Fed index increased 8.1 points to 12.9 as the new orders index was up 15.5 points to 22.1 and the shipments index was up 1.3 points to 18.9. Those readings look like we are back in 2018 when the manufacturing sector was soaring and the ISM PMI was extremely high. The 6 month forward looking index fell 0.7 to 22.9 as it was positive, but not as great as it was in most of 2018.
The Philly Fed index increased significantly. The general business conditions index was up from 17 to 36.7 which was a 3 year high. This more than tripled estimates for 12, making it the biggest positive surprise ever. The highest estimate was 14.6 which was also easily beat. The new orders index was up from 18.2 to 33.6 which was the best reading since May 2018. Expected business conditions in the next 6 months rose from 38.4 to 45.4 which was the best reading since March 2018. It’s clear the regions covered by the Empire and Philly Fed reports weren’t impacted by the coronavirus or the Boeing delays.
Last month the Philly Fed index also spiked. The index is up 34.3 points in the past 2 months which is the largest 2 month spike since September 1995. In the history of this report, which goes back to 1980, there have only been 2 other instances where the 2 month change was better.
The shipments index was only up from 23.4 to 25.2. Just like in the Empire Fed index, the prices received index rose and the prices paid index fell. Prices received rose from 14.7 to 17.1 and prices paid fell from 22.1 to 16.4. Despite this margin improvement, the number of employees index fell from 19.3 to 9.8.
The expectations category did well. The expected new orders and shipments indexes were up from 41.9 and 42.4 to 54 and 51.9. Even though the expectations index was up, the capex index fell from 32.9 to 29.8. Even though the Empire and Philly Fed indexes spiked, the flash manufacturing PMI fell. We will detail its decline in a future article.
No Recession Coming Soon
As you can see from the chart below, the Leading Economic Indicators yearly growth rate didn’t fall below 0% in January which means it avoided giving a recession warning again. Specifically, the yearly growth rate improved from 0.1% to 0.9%. Yearly comps are getting easier which makes a negative growth print in 2020 unlikely.
The monthly growth rate rose from -0.3% to 0.8% which beat estimates for 0.3% and the highest estimate which was 0.5%. Usually this index doesn’t beat or miss estimates by a lot because most of the data in it is already public before it is released. Jobless claims helped the index by 0.32% after hurting it by 0.23%. We knew that would happen because claims only spiked in December for seasonal reasons (the late Thanksgiving). Building permits helped the index by 0.26% after hurting it by 0.12%. The housing starts report showed permits spiked in January. They might not be as strong in February because it won’t be as unseasonably warm. The stock market helped the index by 0.12%. It will likely help the index in February as well as the S&P 500 is up 4.6% month to date. The table below gives a complete review of the monthly impacts to the leading index in January.
The 6 month average of the leading index was up just 0.1% which is a 0.2% annualized rate. That’s below the 0.8% growth (1.6% annualized) in the prior 6 months. If the manufacturing sector continues turning around, growth will accelerate. The spike in new orders in the Empire Fed and Philly Fed indexes might mean the ISM new orders index will increase too. That depends on how the coronavirus and the Boeing delays impact the national numbers. In comparison to the Leading Economic Indicators report, in the week of February 14th, the ECRI leading index fell 0.4 to 147.7 which sent its growth rate down 1 point to 3.8%. However, it’s still implying a further recovery in 2H 2020. The January Coincident ECRI index rose 0.1 to 187.5 pushing the yearly growth rate down 0.2% to 1.5% as it closes in on the 2016 growth rate trough.
Capex Boom?
The chart below compares the capex spending plans in the regional Fed reports with the S&P 500’s capex growth rate.
We could see an economic recovery similar to the one in 2017 and 2018 (because of the tax cut) if capex increases further. The be clear, as of February 19th 411 S&P 500 firms reported their Q4 earnings results. Average EPS growth was 7.43% as the EPS surprise rate was 4.75%. Sales growth was 4.13% as firms beat estimates by an average of 1.23%.
Impact Of Coronavirus On Chinese GDP Growth
The Shanghai Composite is up 10.32% since February 3rd which is after it crashed in its first day of trading after the new year celebration ended. It’s only down 1% since January 22nd which is right after the virus was first discovered. The growth rate of deaths and new cases is falling, but economic growth is still being hampered. China reported 118 new deaths on February 20th which brought the total to 2,236. There were 889 new cases which brought the total to 75,465. The good news is over 2,000 people were cured and discharged.
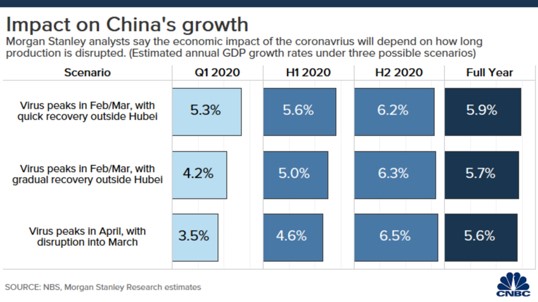
Morgan Stanley has calculated 3 possible scenarios on how the coronavirus impacts China’s GDP growth.
If the impact of the virus peaks in February and March with a quick recovery outside of Hubei, there will be 5.3% Q1 GDP growth and 5.9% yearly growth. If it peaks in that time with a gradual recovery outside of Hubei, then Q1 growth will be 4.2% and 2020 growth will be 5.7%. Finally, if the virus peaks in April and there is disruption into March, then Q1 growth will be only 3.5% and 2020 growth will be 5.6%. Remember, by the time the Chinese Q1 GDP report comes out it will be an afterthought because investors see the weakness as transitory.
Conclusion
Soft data reports suggest the manufacturing sector is recovering. Once the coronavirus is over and the Boeing 737 Max’s delay ends, the manufacturing sector should be in great shape. Capex growth should improve in 2020. It will be funded by increased profits. Outside of Q1, we should see very strong EPS growth. The coronavirus will lead to 2020 Chinese GDP growth being between 5.7% and 5.9%.
Have comments? Join the conversation on Twitter.
Disclaimer: The content on this site is for general informational and entertainment purposes only and should not be construed as financial advice. You agree that any decision you make will be based upon an independent investigation by a certified professional. Please read full disclaimer and privacy policy before reading any of our content.


