UPFINA's Mission: The pursuit of truth in finance and economics to form an unbiased view of current events in order to understand human action, its causes and effects. Read about us and our mission here.
Reading Time: 5 minutes
The Fed claims to have shifted dovishly partially because inflation has fallen this year. However, core PCE inflation has been below 2% for most of this cycle, so that’s not a complete reason. The main reasons the Fed is about to cut rates are the cyclical slowdown and the impact of the uncertainty that the trade war has created for the economy. Obviously, inflation is correlated with the economy, but, on its own, low inflation shouldn’t be a problem. Low inflation is still important though because it gives the Fed clearance to cut rates to help the economy.
In May, headline PCE inflation was 1.5% which was down from 1.6%, but beat estimates for 1.4%. The all important core PCE inflation rate was 1.6% which matched April’s reading and beat estimates for 1.5%. That’s a relatively solid reading considering the tough comparison of 1.96%. Luckily for the Fed, it won’t need to worry about easier comps until next January.
The Fed has at times stated it needs to see core PCE inflation sustain at 2%. In that case, it should never have raised rates this cycle unless it was raising rates to cut them in the next recession. Even though the Fed has stated it wants sustained inflation, it would face criticism if it cut rates with core PCE inflation above 2%. That’s why it’s good for the dovish argument that it’s unlikely core PCE will get above 2% for the rest of the year because of the slowdown and tough comparisons.
Inflation Estimate & Breakdown
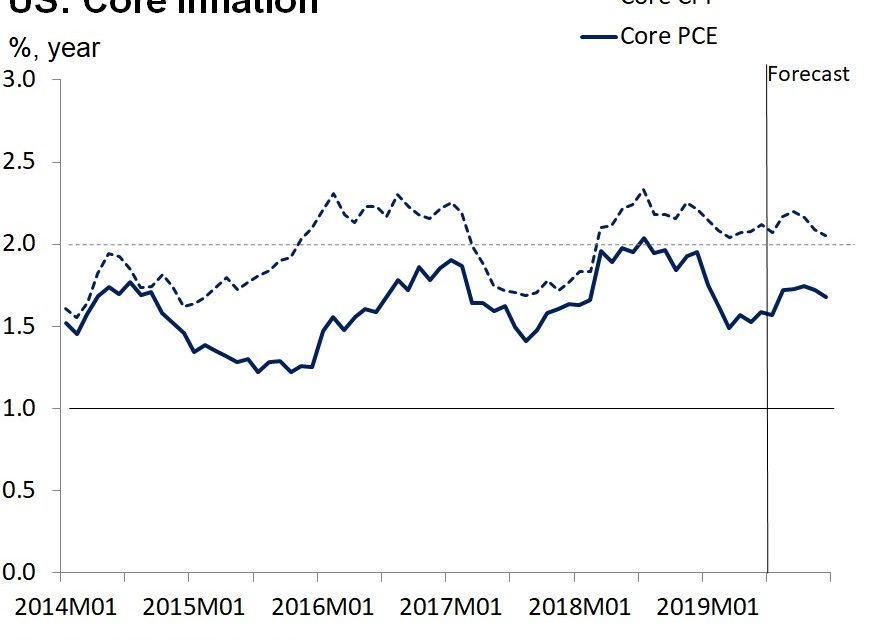
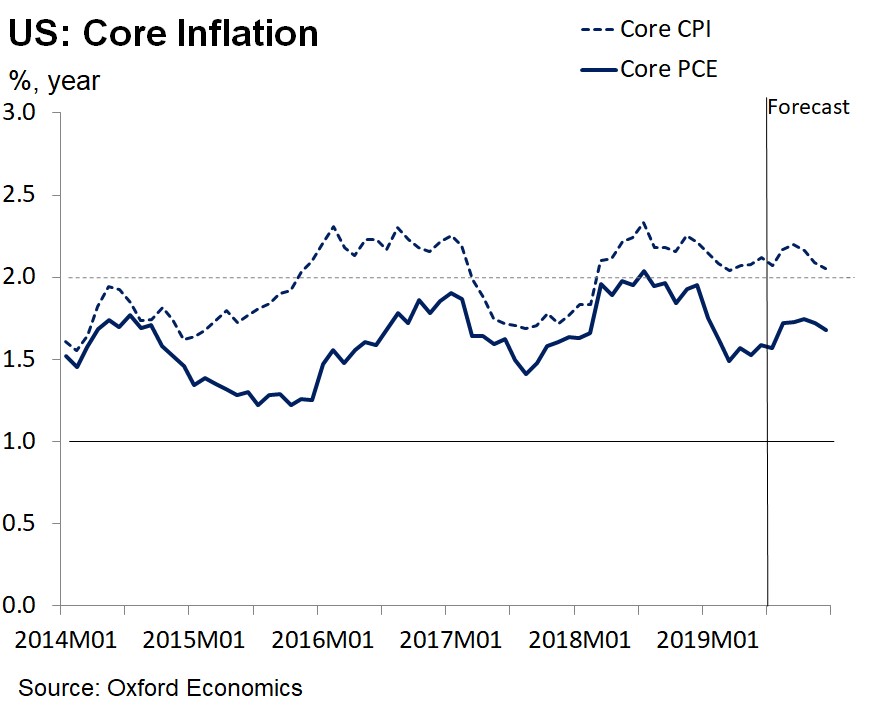
As you can see from the chart below, Oxford Economics sees core PCE inflation staying below 2% and core CPI falling towards 2%. Oxford Economics sees growth slowing this year and 3 rate cuts in the next 9 months.
The chart below shows the breakdown of what each portion of core PCE inflation needs to be at to get it to 2%.
Many market participants are starting to believe that core PCE inflation above 2% on a sustained basis is an unreasonable assumption. That may be the case in the short-term, but in any case, for core PCE inflation to be higher its likely that healthcare services and pharmaceuticals & core services excluding housing and healthcare would need to increase. We are well aware how unaffordable and expensive health insurance is for many Americans. The Fed needs healthcare inflation to go up to meet its 2% target. Some economists don’t think the economy needs such price increases to be strong. After all, the best economy provides strong real wage growth to workers. Inflation takes away nominal wage gains.
Income & Spending Growth
The best part of the PCE report was the solid headline income growth. Monthly personal income growth was 0.5% which beat estimates for 0.3%. As you can see from the chart below, real yearly disposable income growth was 2.3%.
Real consumer spending growth was 0.4% monthly which met estimates. In April it was revised from 0.3% to 0.6%. It was 2.7% yearly. The chart shows the difference between real income and spending growth shrunk which is great news. The savings rate was stuck at 6.1% which is relatively low. It’s 0.1% above the lowest rate since March 2013.
Personal income growth was driven by proprietors’ income with inventory valuation and capital consumption adjustments. Its growth was 0.8% monthly while wages and salaries growth was only 0.2%. Monthly growth in personal interest income was an enormous 2.3% which is on top of 2.4% in April. Before that, its monthly growth was -1.4% for 3 months. In Q1 these numbers were reversed in that proprietors’ income was down 3% and interest income fell 7.4%. Looking at May’s consumption growth data, spending on durable goods was up 1.7%, spending on non-durable goods fell 0.1% monthly, and spending on services was up 0.4%.
This PCE report caused the Atlanta Fed GDP Nowcast estimate for real personal consumption expenditures growth to fall from 3.9% to 3.7%. That’s still much better than Q1’s growth which was only 0.9%. Q2 could see lower GDP growth, but higher consumption growth. Q1 was highly unusual as it had great headline growth of 3.1% and poor consumption growth. GDP growth is usually driven by consumption.
Solid University Of Michigan Sentiment Survey
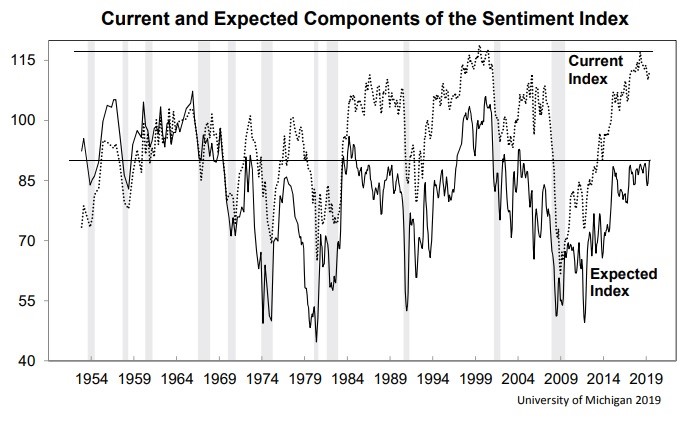
The June University of Michigan consumer sentiment index increased from its initial reading. It went from 97.9 to 98.2 which was still below May’s reading of 100. The weakness was all about expectations. That index fell from 93.5 to 89.3. The current index, which is more closely related to discretionary spending growth, increased from 110 to 111.9.
This solid report isn’t in line with the weakness seen in the Conference Board Index. The Conference Board index’s weakness was driven by low income earners and the Michigan report’s modest decline was driven by high income earners. Specifically, those with income in the top 3rd of households drove the small decline. The percentage of consumers mentioning tariffs increased from 30% to 45%. Even though almost half of consumers know about this negative catalyst, the current index was very strong.
In June, the estimate for inflation in the next year fell from 2.9% to 2.7% and in the next 5 years it fell from 2.6% to 2.3%. Interest rates were expected to increase by the fewest consumers in 6 years. Declines in mortgage rates have helped home buyers. This report is consistent with real personal consuption growth of 2.5%. It was 2.7% in the June PCE report.
Terrible Chicago Fed PMI
The Chicago Fed PMI was a disaster as it fell from 54.2 in May to just 49.7 in June. That missed the consensus of 53.6 and the low end of the estimate range which was 52. It was the first contraction since January 2017 as you can see in the chart below.
To be clear, the Chicago Fed report includes responses from the services sector, so it’s not directly comparable to manufacturing reports.
Business confidence averaged 52.2 in Q2 which is down 13% sequentially and down 16% from last year. The production index hit a 3 year low and was down 15.5% on the quarter. The employment index fell to 50.8 in Q2 which is the worst reading since Q4 2016. 80% of firms mentioned they were negatively impacted by tariffs, with tariffs raising prices of their goods leading to a decline in orders.
Conclusion
Core PCE inflation is far enough from the Fed’s 2% target to allow it to cut rates. Personal income growth was strong in May. It was driven by growth in interest income and growth in sole proprietors’ income. Wages and salaries growth was just 0.2% monthly. Consumer confidence was solid and in line with the PCE report. Q2 consumption growth will be stronger than Q1, but headline growth will be weaker if the Atlanta Fed’s estimate is correct. The Nowcast sees 1.5% Q2 GDP growth. GDP growth was 3.1% in Q1. The June Chicago Fed PMI was terrible. It signals a contraction in manufacturing and non-manufacturing activity.
Have comments? Join the conversation on Twitter.
Disclaimer: The content on this site is for general informational and entertainment purposes only and should not be construed as financial advice. You agree that any decision you make will be based upon an independent investigation by a certified professional. Please read full disclaimer and privacy policy before reading any of our content.


