UPFINA's Mission: The pursuit of truth in finance and economics to form an unbiased view of current events in order to understand human action, its causes and effects. Read about us and our mission here.
Reading Time: 4 minutes
We don’t want to overreact to one month of data from the leading economic index. That’s especially true for May because the S&P 500 cratered 6.58% in that month. However, the index has been showing signs of slower growth for a few months even when the stock market rose. In May, the leading index was flat month over month which missed estimates for 0.1% growth. Also, the April reading showed 0.1% growth instead of the originally reported 0.2% growth. Surely, the index will be helped by the big stock market rally in June, but that might only temporarily stave off a recessionary signal rather than signal a new trend.
In May, the index was helped by the consumers’ outlook and the leading credit index. It was hurt by the stock market, the ISM new orders index, and jobless claims. The ISM manufacturing index might take a hit in June based on the first two regional Fed reports. We will review the Philly Fed index later in this article. In the 6 month period leading up to May, the leading economic index was up 0.3% which is much lower than the 2.2% growth in the previous 6 month period.
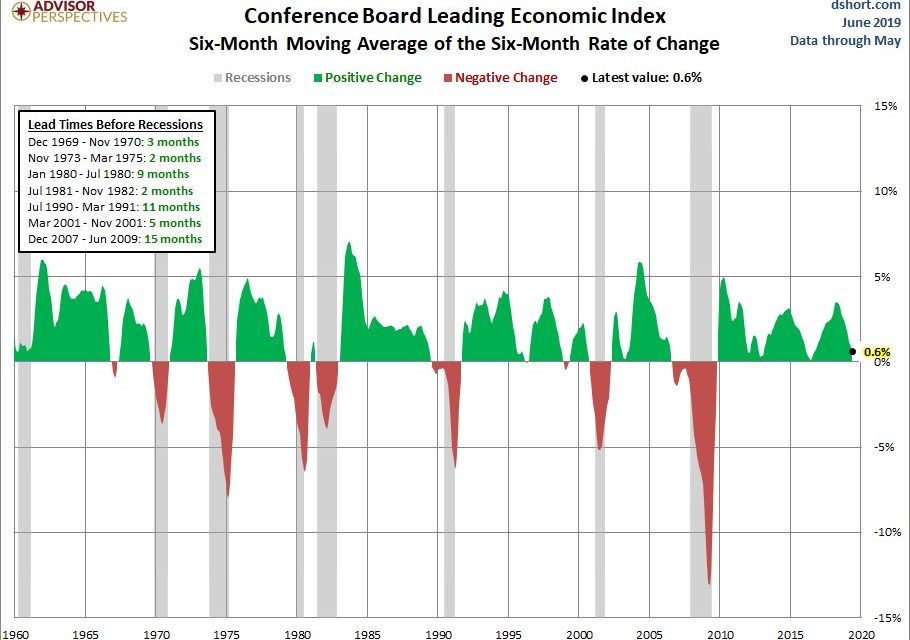
As you can see from the chart below, the 6 month moving average of the 6 month rate of change was up 0.6%.
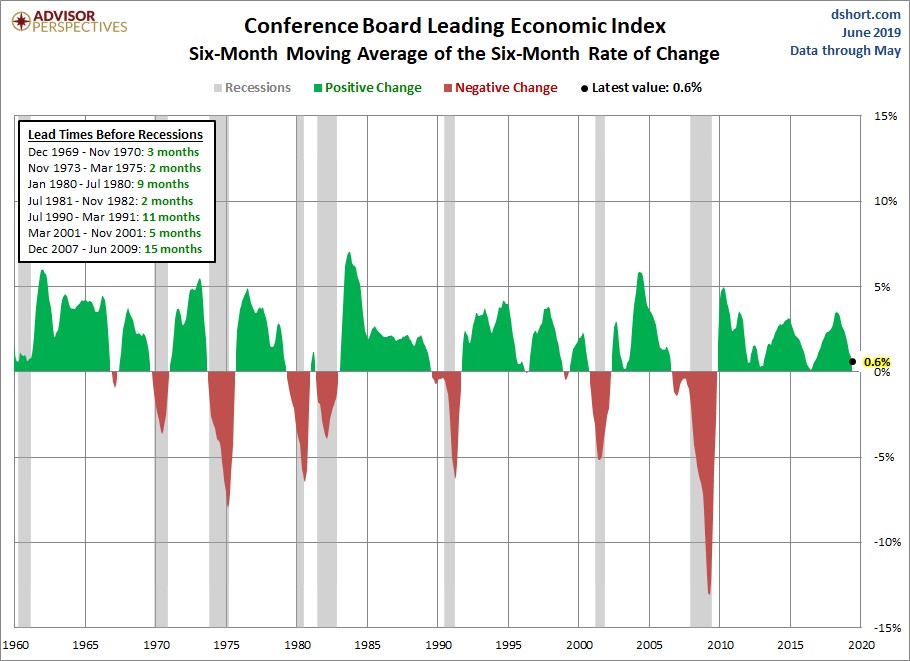
Since 1960, there have been 2 instances where this index has gone negative without there being a recession soon after. In the past 7 cycles, this index has gone negative between 2 and 15 months before recessions. This index can easily give off another warning later this year.
Weak June Philly Fed Index
The June Empire Fed manufacturing report was a complete disaster probably because of trade tensions. We said to wait until more data came out before getting worried because the index is volatile. On Thursday, the 2nd regional Fed index came out. The Philly Fed index wasn’t a historic disaster, but it wasn’t good either as the general business conditions index fell from 16.6 to 0.3 which missed estimates for 11 and the lowest estimate which was 2. The manufacturing slowdown in June could be real.
The good news is the sentiment index is one question, not a composite and some of the underlying numbers weren’t devastating. For example, the new orders index only fell from 11 to 8.3. That means 38.2% of firms saw new orders increasing and 29.9% saw them falling from May. That’s not exactly a manufacturing recession. None of the sub-components were negative. As you can see from the chart below, trade tensions have caused a bottleneck in delivery times and inventories.
The unfilled orders index increased from 1.9 to 10.2. The delivery times index was up from 3.4 to 15.6. Finally, the inventories index increased from -3.1 to 2.4.
Supporting the notion that the Philly Fed index sees moderate weakness rather than a recession are the special questions. Specifically, 58.7% of firms expect Q2 production to be above Q1 production and only 25.7% expect a decline. In Q3, 49.1% of firms surveyed expect production to accelerate and only 26.3% see growth declining. The 6 month expectations index for business activity rose slightly from 19.7 to 21.4. The 6 month expected new orders index rose 10.2 points to 31.5. Finally, the expected capex index rose from 23.3 to 28.
Potentially Contractionary Manufacturing PMI Coming
It’s no surprise that when you combine the dreadful Empire Fed index with the weak headline index from the Philly Fed that you get a low average. As you can see from the chart below, the average of the two indexes has an 89% correlation with the ISM PMI.
This average implies the PMI will be close to 50 if not below 50. This average seems to have more negative readings that don’t live up to the hype than positive ones, so by no means does this mean the ISM PMI will be weak. Luckily, we don’t need to rely on just those 2 as there are 3 other regional Fed readings.
The Dallas Fed index comes out on the June 24th, the Richmond Fed report comes out on June 25th, and the Kansas City Fed report comes out on June 27th. An ISM PMI below 50 would send stocks lower. Since stocks are elevated even after the weak Philly Fed report, you might not lose out on potential profits by waiting until the other regional Fed reports come out before going bearish. They will give us a better idea if the ISM PMI will be weak. Keep in mind, if there’s a trade deal, then these results will be ignored because trade tensions are partially why they are weak.
How Is The Economy Doing?
The CNBC median of GDP growth estimates shows Q2 GDP growth will be 1.9%. The chart below shows an alternative calculation of economic growth.
Its inputs include, jobless claims, intermodal freight transportation, consumer comfort, Redbook retail sales, oil prices, federal taxes and spending, and other proprietary data. As you can see, the economy is in a slowdown, but there’s no reason to fear a recession yet. Activity is consistent with about 2.5% yearly GDP growth.
Bear Market Coming?
Instead of comparing the yield curve with recessions, the chart below compares it with bull and bear markets.
Usually, when the 10 year 3 month curve inverts and then steepens, there is a bear market. The main exception was in the early 1990s. Some investors think the current inversion is just because the Fed has rates too high. Others think the curve is done flattening and when it steepens, there will be a recession. The 10 year 2 year differential never inverted as it bottomed at 9 basis points in December 2018. Some think that was the inversion moment which means when the curve steepens sharply, there will be a recession.
Conclusion
The leading index is close to giving a recessionary warning. The Philly Fed and Empire Fed average signal the ISM PMI will be weak. That being said, unlike the Empire Fed reading, the details of the Philly Fed reading weren’t terrible. The 6 month expectations index increased. The weekly activity index signals yearly economic growth is about 2.5%. The inversion moment might have happened. The next steepening in the yield curve might come along with a recession.
If you are interested in what happens during a recession, check out this great article from Fat Tailed And Happy blog.
Have comments? Join the conversation on Twitter.
Disclaimer: The content on this site is for general informational and entertainment purposes only and should not be construed as financial advice. You agree that any decision you make will be based upon an independent investigation by a certified professional. Please read full disclaimer and privacy policy before reading any of our content.


