
UPFINA's Mission: The pursuit of truth in finance and economics to form an unbiased view of current events in order to understand human action, its causes and effects. Read about us and our mission here.
Reading Time: 5 minutes
The biggest question on monetary policy is how close the Fed is to ending its tightening cycle. While bullish investors may want the Fed to stop pressing on the breaks, which is the analogy for raising rates, usually after the hike cycle ends there is a recession. That’s a situation where the bulls need to be careful what they wish for. Some think inflation is low enough for the Fed to slow down its hike cycle and others think rising wage growth necessitates even more rate hikes.
As you can see from the chart below, the cumulative tightening in the effective Fed funds rate is much smaller in this cycle than in previous hike cycles.
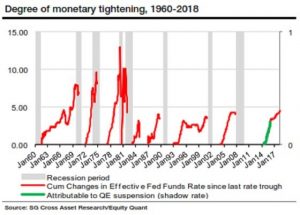
If you add the attribution of the suspension of QE, this hike cycle has a similar magnitude to the last few hike cycles. It’s questionable if QE can be calculated in this way because some view QE as an asset swap which doesn’t affect markets. The Fed seems to have wanted markets to believe QE was helping when it was in place, but then the Fed downplayed its effects after it ended. The yield curve tells us when the Fed will stop its hike cycle. Since the difference between the 10 year yield and 2 year yield is 26 basis points, the hike cycle might be close to ending.
Fed Makeup
The Fed is often thought of as a uniform body that always agrees with the Fed chair, but that’s incorrect. The chair doesn’t always get his or her way and the voting members are shuffled each year although some stay the same. The table below shows the changes to the FOMC voters in 2019 and 2020.
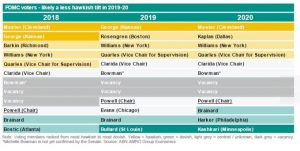
Source: ABN AMRO Group Economics
As you can see, one hawk drops out in 2019 (one less member with yellow shading) and one dove is added in 2020 (one more member with green shading). That means the Fed could be more dovish in the future. If only predicting Fed decisions was this easy. Sometimes voters such as Kashkari fluctuate between being hawkish and dovish. There’s a dispersion in the current dot plot for 2019 as 4 think rates should be 3.375%, 4 think rates should be 3.125%, and 4 think rates should be 2.875%. 3 others think rates should be lower. Economic data and the Fed fund futures will determine policy.
Italian Recession Coming?
As we mentioned in a previous article, the Fed and ECB have different policy prescriptions. As you can see, inflation is near the same for both areas, but the German one year yield and the Fed funds rate have diverged.
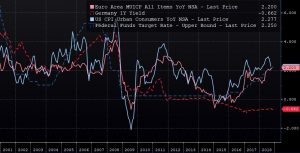
Source: Bloomberg
It’s important to keep two things in mind. Firstly, if the Fed didn’t have rates this high, inflation might be higher and if the ECB raised rates European inflation might be lower. Secondly, the European economy is decelerating quickly as estimates for 2018 German GDP growth have fallen from 2.5% in March to 1.6%. Also, the Italian economy looks like it is about to fall into a recession which would be hugely problematic for its banking system and debt woes. In the October Markit services PMI, Italy had the weakest new business expansion in 44 months. As you can see from the chart below, its PMI was 49.2 which is consistent with GDP contraction. New order growth was the weakest in 3.5 years.
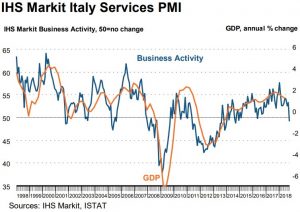
Source: Markit
Latest Inflation Data
Let’s quickly review the latest inflation data to get an updated look at Fed policy. The headline October PPI report beat estimates by a lot, but core growth slowed. The month over month headline PPI growth of 0.6% was the highest in 6 years as it beat the consensus and last month’s reading of 0.2%. Energy and trade services drove inflation. Energy was up 2.7% month over month and 12.5% year over year. That will reverse in November because oil fell 10 days straight which is the longest decline in 34 years. Trade services were up 1.6% month over month, but only 1.5% year over year. Year over year headline inflation was 2.9% which was up from 2.6%.
Excluding food and energy, inflation was the highest in almost 7 years as it increased 0.5% which beat estimates and the consensus for 0.2%. Year over year it increased from 2.5% to 2.6%. The Fed will focus on the core inflation reading which excludes food, energy, and trade services. It increased 0.2% month over month which met estimates and fell from 0.4%. Year over year it fell from 2.9% to 2.8%. Food prices were up 1% month over month, but down 0.7% year over year. The Fed won’t change policy because of this report because core inflation fell and headline inflation will weaken next month. This report raises expectations for the CPI report on November 14th.
The inflation expectations in the preliminary consumer sentiment report were well anchored as the estimate for 1 year inflation fell 0.1% to 2.8% and the estimate for 5 year inflation increased 0.2% to 2.6%. By the way, the consumer sentiment report fell from 98.6 to 98.3 which is a fantastic reading signifying that consumers didn’t react negatively to the correction in stocks.
ECRI Predicting Gloom
Based on the ECRI reading, the Fed shouldn’t be hiking rates at all because a sharp slowdown is coming. It’s no surprise the year over year reading has started to be sharply negative as it is facing much tougher comparisons. The toughest are yet to come as it grew almost 9% in February. As you can see from the chart below, the ECRI reading shows a 2.6% year over year decline which is the weakest reading in 139 weeks.
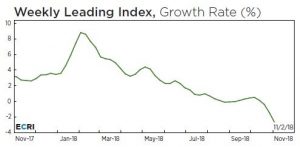
Source: ECRI
Economic slowdowns result in more volatility in the stock market as it creates more uncertainty and increases the probability of a recession. As you can see from the chart below, the shaded bars are noted economic slowdowns by the ECRI. When the bars are shaded, there is more volatility. There have already been 2 corrections during this slowdown. Just because stocks recovered from the latest one doesn’t mean we are in the clear as the index is weakening almost every week.
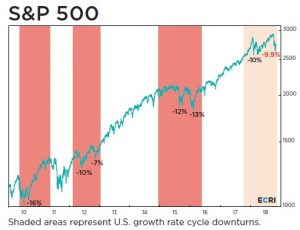
Source: ECRI
Conclusion
The Fed funds rate is nearing the neutral rate. When the rate gets above the neutral rate, it means Fed policy is slowing the economy. The European and Chinese economies are already slowing. The fiscal stimulus ending and the trade war are negative catalysts for growth in 2019. ECRI is predicting a sharp slowdown. If the yield curve inverts and the ECRI leading index falls further, it will be time to be concerned about an increased potential for a recession.
Have comments? Join the conversation on Twitter.
Disclaimer: The content on this site is for general informational and entertainment purposes only and should not be construed as financial advice. You agree that any decision you make will be based upon an independent investigation by a certified professional. Please read full disclaimer and privacy policy before reading any of our content.


