UPFINA's Mission: The pursuit of truth in finance and economics to form an unbiased view of current events in order to understand human action, its causes and effects. Read about us and our mission here.
Reading Time: 4 minutes
As we mentioned in our article on the CPI report, shelter inflation has been falling. It is dragging down the entire reading because it is the largest portion of the report. It is being driven lower by the eviction moratorium and people fleeing cities for suburbs. The 1.6% shelter inflation rate in January was the lowest rate since August 2011. Regardless of what commodities prices do, we won’t see much higher CPI until the moratorium on evictions is lifted and people move back to large cities. That will probably be a late 2021/early 2022 story (too early to tell).
Remember, shelter CPI is based on rent prices. The chart below shows the owner’s equivalent rent inflation rate broken down by city size. As you can see, the yearly percentage increase fell from about 1.6% to about 1.1% for small cities. It fell from about 1.8% to about 0.9% for large cities.
Massive Laundry Inflation
On the other end of the spectrum, spending on home improvements and consumer durables increased rapidly following the pandemic as more people bought houses and spent more time indoors. It wasn’t just demand for toilet paper that increased. There was also a big spike in demand for laundry equipment. Combining that with the huge spike in bottlenecks in the supply chain has led to high inflation on certain products.
As you can see from the chart below, laundry equipment inflation recently hit 23.1%. That’s higher than it was after the tariffs were enacted.
This inflation should subside after the pandemic as the port issues will go away and demand will fall. There will be less demand than usual for home improvement and consumer durable products in the 2nd half of 2021 because a lot of demand was pulled forward. Furthermore, higher housing prices should deter some marginal buyers from getting a house.
Excluding Ohio, Claims Fell
There was a 33,000 upward revision to the prior week’s initial claims report. The entire decline was rescinded. In the week of February 6th, seasonally adjusted claims fell to 793,000 which was 33,000 above estimates. Supposedly, the state’s massive spike in claims was largely due to attempted fraud. Not only have people who need the money not been able to get it at times in this pandemic, but also people who don’t deserve it are stealing it. This is the worst of both worlds. The states have outdated systems, so this fraud is to be expected.
Non-seasonally adjusted claims in Ohio were up 90,000 to 138,000, so we ignored that state. Excluding Ohio, NSA claims fell 129,000 to 675,000 which was the lowest in 47 weeks. PUAs fell 34,000 to 335,000.
This is the 4th straight week NSA initial claims combined with PUAs fell. This is the initial start of what should be a sharp recovery in the labor market in the next 1-2 months. In the week of January 23rd, the total people on all benefits rose from 17.8 million to 20.4 million. Just because we are encouraged by the rate of improvement of initial claims, doesn’t mean we don’t see the current large black hole in the labor market. Continued claims in the week of January 30th fell from 4.69 million to 4.545 million.
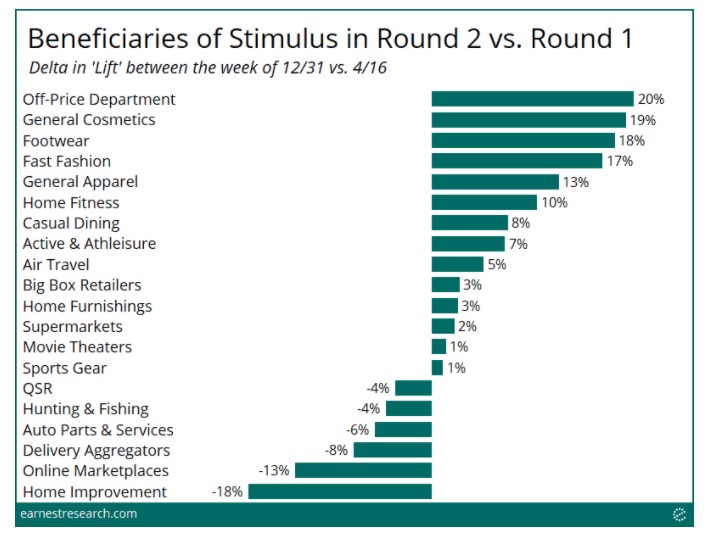
The 2nd Stimulus Was A Lot Different
The second stimulus was distributed in early January which was the worst part of the third wave of the pandemic. Even still, its effect on spending habits was much different than the first round of checks in April 2020. That’s probably because in early January there was a bleak light at the end of the tunnel as the vaccines had just started going out. The chart below shows the sales lift from the stimulus. That’s the growth improvement, not the actual growth rate.
As you can see, off-price department stores such as Ross had the largest lift. There was also an increase in spending on clothes, cosmetics, and dining. There was a tiny lift in air travel spending. On the other hand, spending growth on home improvements, online market places, and auto parts and services fell.
This stimulus is a preview of the impact the March $1,400 stimulus will have on the economy. The pandemic has been curtailed significantly since early January. It will be further curtailed by the time these checks go out. Plus, these checks are much larger than the $600 ones earlier this year. There will be a huge boon in spending on travel this spring as people book trips in anticipation of a return to normalcy.
The part of this stimulus that is similar to the last one is it caused a boost in spending by the lower income class. That’s because they got most of the checks. Plus, they spend a larger portion of their income on non-discretionary items. There will be an onslaught of consumer spending when high income earners start spending their hoard of cash they saved up during the pandemic.
New Trends Emerge
We are in the early innings of a rapid transformation in the economy. Travel and entertainment will become the hottest parts of the economy, while online electronics and home improvement take a dive. The table below shows spending growth in late January and early February. The yearly growth in spending on lodging rose 5 points and spending growth on entertainment rose 8 points. Obviously, the growth rates will be large when the easier comps start. However, nominal spending will also increase. On the other hand, growth in spending on home improvement fell 1 point and spending growth on online electronics fell 10 points.
Conclusion
Shelter should keep a lid on CPI even as commodity prices stay strong. Once rent inflation comes back, that will revert. NSA claims fell sharply when you exclude Ohio. The January stimulus changed spending habits differently than the first one. The March 2021 stimulus will be even more different as the post pandemic future will be near. Spending on online electronics should fall. Spending on travel and entertainment should increase considerably in the coming months.
Have comments? Join the conversation on Twitter.
Disclaimer: The content on this site is for general informational and entertainment purposes only and should not be construed as financial advice. You agree that any decision you make will be based upon an independent investigation by a certified professional. Please read full disclaimer and privacy policy before reading any of our content.


