UPFINA's Mission: The pursuit of truth in finance and economics to form an unbiased view of current events in order to understand human action, its causes and effects. Read about us and our mission here.
Reading Time: 4 minutes
The jobless claims report from the week of September 12th was important for a few reasons. Firstly, it was the BLS survey week for the September report. Secondly, non-seasonally adjusted claims were up 2 straight weeks, so the trend needed to change. Thirdly, unemployment claims need to fall in the next 5 weeks before benefits given to the initial batch of people who lost their jobs in March start to run out. Many will move to a pandemic related benefits program which could be a mess.
We’ve seen such a huge number of continued claims because almost everyone who lost their jobs in this recession did so in March and April. Even now, continued claims are about double the previous cycle high even though the unemployment rate is 8.4% which is lower than the previous cycle’s peak of 10%. Obviously, the unemployment rate is impacted by changes to the labor participation rate. We’re just showing how many people are on continued claims.
Very Good Claims Report
This was a very strong report. The less important, seasonally adjusted initial claims fell from 893,000 to 860,000. The seasonal adjusted number became less important after the pandemic because seasonality is basically irrelevant in such a situation with massive influx in the labor market. With the change to the seasonal factor last month, it became even less important. As you can see from the chart below, NSA claims fell sharply from 866,000 to 790,000 which is a new cycle low. That ended the 2 week increase streak. This number is much closer to normal than continued claims because like we mentioned, most people lose their jobs in March and April. There haven’t been nearly as many job losses in the past few months.
PUAs fell sharply too. In previous articles, we stated that you shouldn’t worry about PUAs because they were artificially manipulated by the results in California, which has dealt with fraud, and Arizona. As you can see above, PUAs fell massively from 868,000 to 659,000. That pushed the total, including normal NSA initial claims, near the trough of the cycle. The table below shows, PUAs in California fell 236,000. That means they contributed to over 100% of the decline. Notice the massive 592,000 decline in PUA continued claims too.
Arizona’s data is still suspect as there was a 64,284 increase in PUAs. That doesn’t make sense. How can Arizona have over 100 times the PUAs Colorado has when it has 7.3 million and Colorado has 5.8 million people? You shouldn’t be bearish on the economy just because of the pandemic claims data. You also shouldn’t heavily rely on it on a week to week basis if it makes no sense.
Continued Claims Continue Their Descent
Continued claims in the week prior fell from 13.544 million to 12.628 million which is a new cycle low. That’ the 6th decline in 7 weeks. The average decline is 618,000. If that rate of change continues, claims will fall below 10 million by the week of October 10th. That’s a lot of claims that run the risk of falling out of the program. This process is going to be hotly discussed in October.
If continued claims were to fall at the recent rate until Christmas, they’d be at 3 million. That’s basically impossible because of the timing of people leaving the program or going on pandemic help. Plus, it will get harder to recover temporary job losses each week they stay on temporary leave. There could be a better than expected improvement if the rapid antigen tests allow the economy to go back to normal this fall. Abbot’s tests are going to be sent to the state governors within the next 1-2 weeks.
Retail Sales Report Was Okay
The August retail sales report was impressive if you take into account the $600 decline in weekly unemployment benefits. If you don’t consider that, this wasn’t a great report. Headline monthly growth was 0.6% which missed estimates for 1% and fell from 0.9%. The worst part of the report was the control group which had -0.2% growth which missed estimates for 0.5% and fell from 1% growth. Yearly headline growth rose from 2.4% to 2.5% and yearly control group growth fell from 7.5% to 7.2%.
These reports are more interesting than they usually are because there has been a massive shift in spending. As you can see from the chart below, sales are 2% above the February peak. Retail sales had a V-shaped recovery because of the strong and timely fiscal stimulus. Online sales are 21% above where they were in February. On the other hand, monthly growth was 0% and yearly growth fell from 23.4% to 22.4%. If online sales growth was below the headline reading, it lost share which is what we expect more of as the economy reopens.
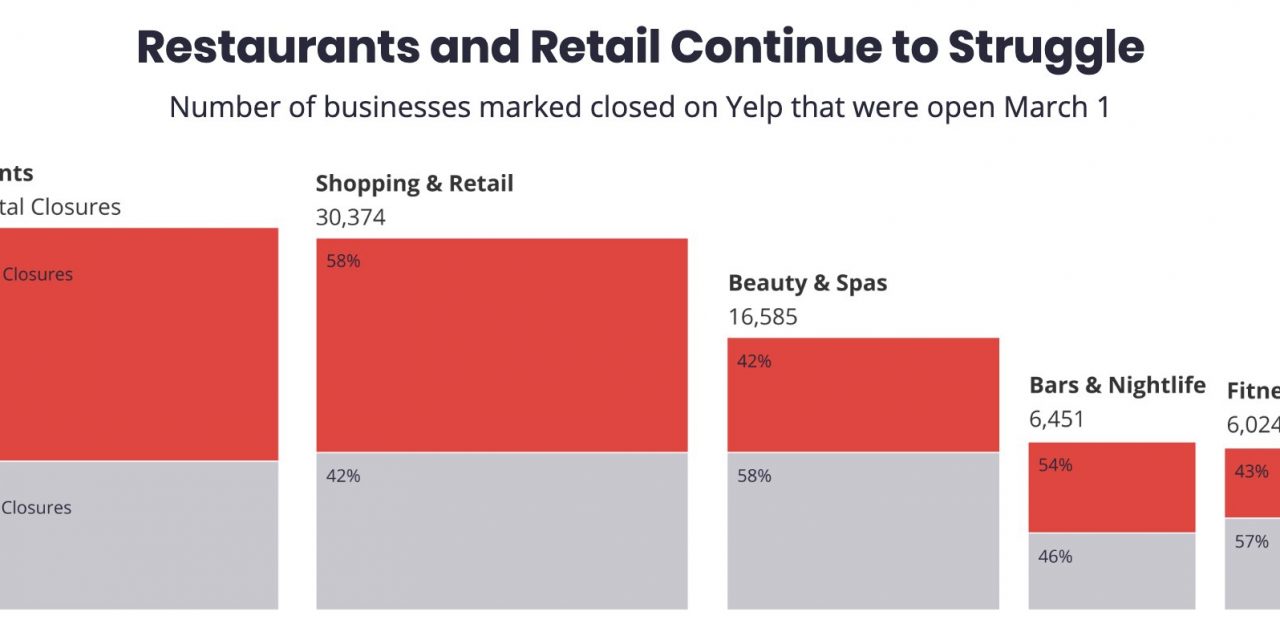
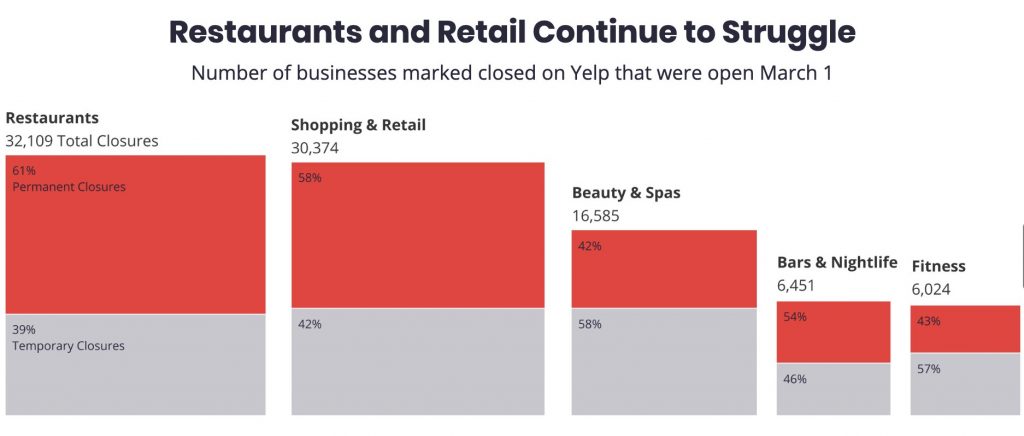
The biggest winner from this report was food services and drinking which is restaurants and bars in layman’s terms. It had 4.7% monthly growth and -15.4% yearly growth which was up 4 points from July. The problem for NYC restaurants is currently they can only have 25% capacity for indoor dining. Once it gets colder out, dining outside isn’t an option. Many small restaurants have gone out of business. Some commentators wonder why big businesses have unlimited access to free money while small businesses are forced to struggle. It would help the economy if it was easier to start a business (more access to cheap capital).
Conclusion
The jobless claims report in the BLS survey week was good which implies the September BLS report will be strong. We are still awaiting the fast COVID-19 tests that allow the economy to fully reopen. Don’t get too bogged down on the pandemic jobless benefits data because it is lumpy and unreliable. The August retail sales report was great if you take into account the $600 decline in weekly benefits. It’s surprising sending didn’t drop sharply. Online retail lost market share and restaurants improved. Many restaurants are going out of business especially in areas where indoor dining is restricted such as NYC.
Have comments? Join the conversation on Twitter.
Disclaimer: The content on this site is for general informational and entertainment purposes only and should not be construed as financial advice. You agree that any decision you make will be based upon an independent investigation by a certified professional. Please read full disclaimer and privacy policy before reading any of our content.


