UPFINA's Mission: The pursuit of truth in finance and economics to form an unbiased view of current events in order to understand human action, its causes and effects. Read about us and our mission here.
Reading Time: 5 minutes
The jobless claims to labor force population ratio hit a record low, the ISM labor market index hit a record high, the unemployment rate is the lowest since 1969, and September average weekly earnings growth of 3.35% was the 3rd highest in this expansion. Those are some of the powerful indicators which show the labor market is full. A full labor market means wage inflation is about to accelerate. Inflation is a catalyst for recessions. Also, if employers can’t find workers even after they raise wages, they won’t be able to expand. The concept of a skills gap is often discussed as some jobs don’t have enough applicants with the proper qualifications. With such tight labor conditions, there simply aren’t enough people to fill positions to help businesses grow.
No Labor Supply Left
To be clear, there are stats that support the claim that there is still supply left in the labor market. We’ll review those later in this article. As you can see from the chart below, the available labor supply as a percentage of employment is at a record low.
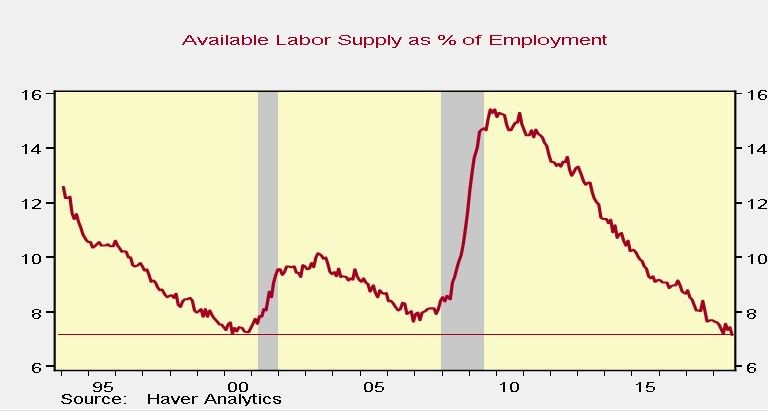
It’s very close to the trough in 2000 and below the trough in 2007. This was Fed chairman Alan Greenspan’s favorite labor market metric. Just like the other metrics we’ve discussed, this shows the labor market is overheating. If there isn’t enough supply to meet demand, there won’t be enough workers to allow businesses to expand in many industries.
Historical Wage Growth
Average hourly earnings and weekly earnings data don’t go back enough to compare this cycle to previous ones. One stat which goes back far is average hourly earnings growth of production and non-supervisory employees of private firms. Current wage growth for those workers is only 2.7% in September. It peaked at 4.2% in 2006 and 4.3% in 1998. Nominal wage growth has been suppressed by low inflation and rates. Another weak point for workers is productivity growth which has been below 1% for most of this cycle. It peaked at 4.5% in 1992, 4.3% in 2002, and only 3.4% in 2010.
Small Businesses Can’t Fill Job Openings
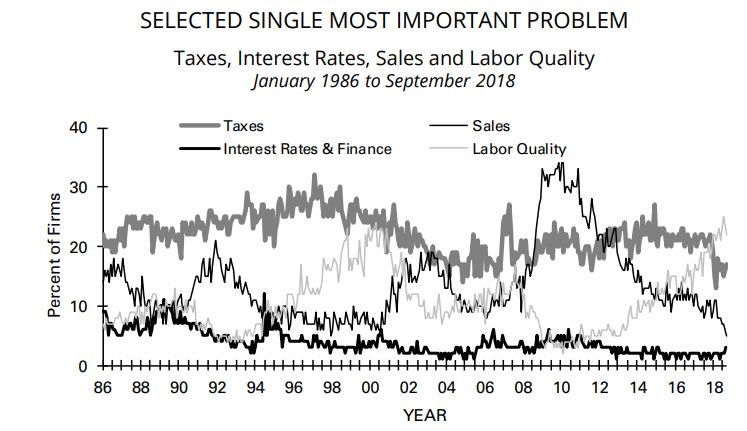
The small business survey shows great historical data on wages and labor quality. In the September NFIB survey, a net 38% of firms stated they couldn’t fill job openings. Labor supporters claim if businesses would offer higher pay and make a real effort to hire people, they could fill these jobs. Obviously, any individual firm can fill a particular position if they are willing to pay any price and work extremely hard to find someone. However, the entirety of firms can’t do that while staying in business. Labor prices would get out of control. Hiring someone is all about the fit. The person needs to have the skills, match the company culture, and get paid an affordable enough salary to allow the firm to be profitable.
61% of small businesses stated they were trying to hire workers and 87% of those firms stated they could find few or no qualified workers. Small firms may not have the capability to train unskilled workers. A record net 37% of firms stated they were raising compensation which is up 5 points from August. The chart below shows labor quality is small businesses’ biggest problem. It is leading the 2nd biggest problem (taxes) by the widest margin ever.
More Supply Available
As we mentioned earlier, there are stats which support the argument that there’s still slack (supply) in the labor market. Many people gave up looking for work after the 2008 recession. These workers have been coming off the sidelines in the past few years, extending this labor market expansion. One important metric which shows there are still workers who want to work full time is the underemployment rate. It’s not as low as the unemployment rate in relation to past cycles. The current underemployment rate is 7.5%. It troughed at 7.9% in 2006 and 6.8% in 2000. There is still room for it to fall.
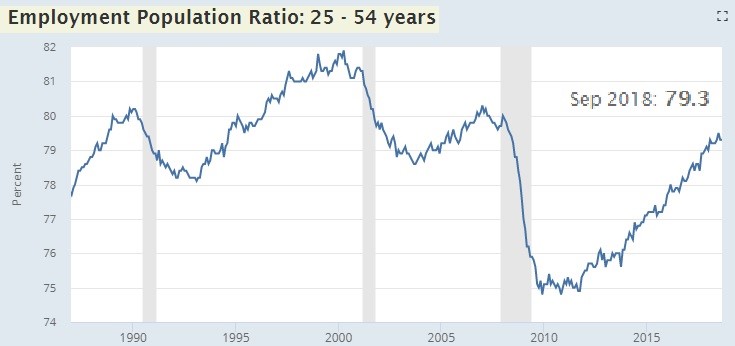
The best argument as to why there’s still supply is that there were 270,000 jobs created in August. That’s more than double the labor force population growth rate. It’s impossible for a full labor market to create that many jobs. Another great stat which shows there is still slack in the labor market is the employment to population ratio for prime age workers. As you can see from the chart below, the current rate is below the peak in each of the past 3 cycles. It could take over 6 years to get to the 2000 peak of 81.9% if it continues the prior year’s pace where it increased 0.4%.
Some College Labor Supply
The chart below shows a much higher percentage of workers have gone to college in 2017 than in 1969.
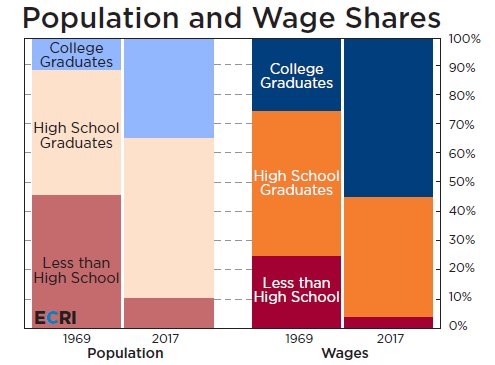
Over 34% of Americans are college graduates which is over triple the percentage in 1969. College graduates are capturing a higher wage share than population share because they get paid more. The wage share increased from about a quarter in 1969 to over half in 2017. Structurally, those with less education have a higher unemployment rate. The increase in college graduates decreases the overall unemployment rate.
In this cycle there has been a greater relative drop in the jobless rate for those with less education. The jobless rate for college graduates isn’t as tight as 2006, meaning there is supply in this segment of the labor market. If these graduates get jobs, average hourly wage growth and consumer spending growth could increase.
Workers Aren’t Happy
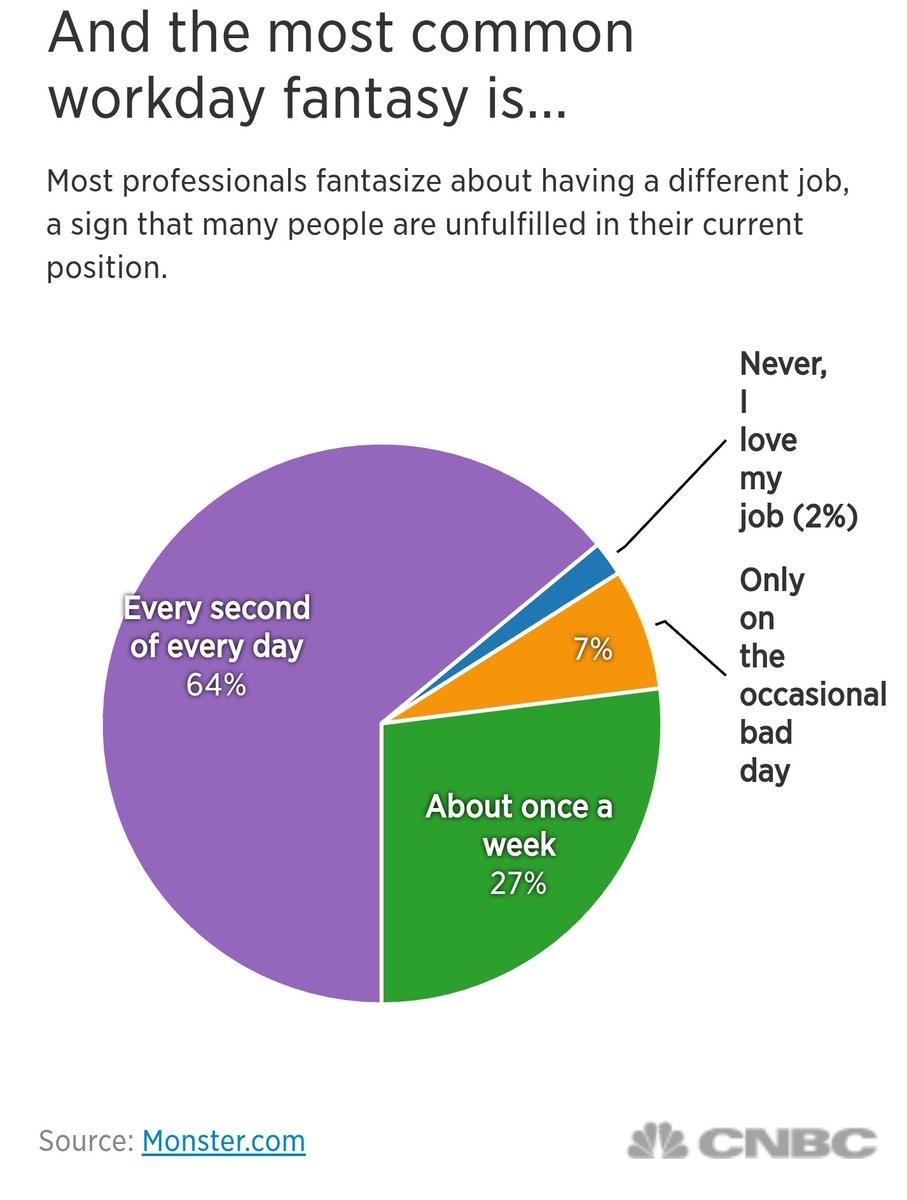
Even though the quits rate is high and the labor market is strong, 64% of workers fantasize about getting a new job every second of every day. You can look at this in a good or bad way. You can feel less alone if you aren’t satisfied by your work or you can feel that there’s intense competition to move up the corporate ladder or to get a job that many people consider fulfilling. You need to decide if it’s worth taking less salary, getting more education, or simply working more and harder to have a more fulfilling career.
Conclusion
The labor market is full according to some measures and has more supply according to others. The easiest way to tell if the labor market is full is to compare current job growth to the labor population growth rate. Even though the labor market is very strong, most workers don’t like their jobs. It takes a lot of hard work and sacrifice to have a fulfilling career. You may need to temporarily disrupt your work life balance if your goal is to advance in a new field that you are passionate about.
Have comments? Join the conversation on Twitter.
Disclaimer: The content on this site is for general informational and entertainment purposes only and should not be construed as financial advice. You agree that any decision you make will be based upon an independent investigation by a certified professional. Please read full disclaimer and privacy policy before reading any of our content.


