UPFINA's Mission: The pursuit of truth in finance and economics to form an unbiased view of current events in order to understand human action, its causes and effects. Read about us and our mission here.
Reading Time: 5 minutes
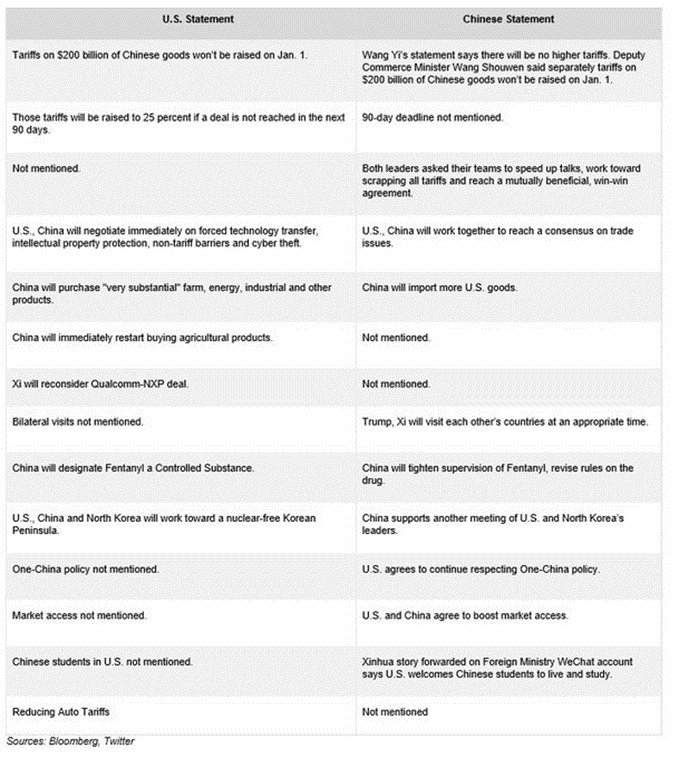
At first the market reacted positively to the G-20 meeting between President Trump and President Xi. Although a deal wasn’t achieved and little progressed was made towards one, at least the tariffs on Chinese goods won’t be raised for 90 days (the tariff rate was originally expected to go from 10% to 25% on January 1st). However, market sentiment quickly changed following recent developments involving the CFO of the Chinese firm Huawei.
America’s statement mentioned a 90 day deadline and China reducing auto tariffs, while the Chinese statement mentioned neither. China mentioned bilateral visits and America recognizing the one-China policy, while America’s statement mentioned neither. Both sides mentioned parts they will benefit from. When making a deal, it’s best to have both parties on the same page. Investors are confused who to believe and don’t know if a deal is likely in 90 days.
Source: Twitter @Driehaus Capitial
Fed Quickly Becoming An Issue
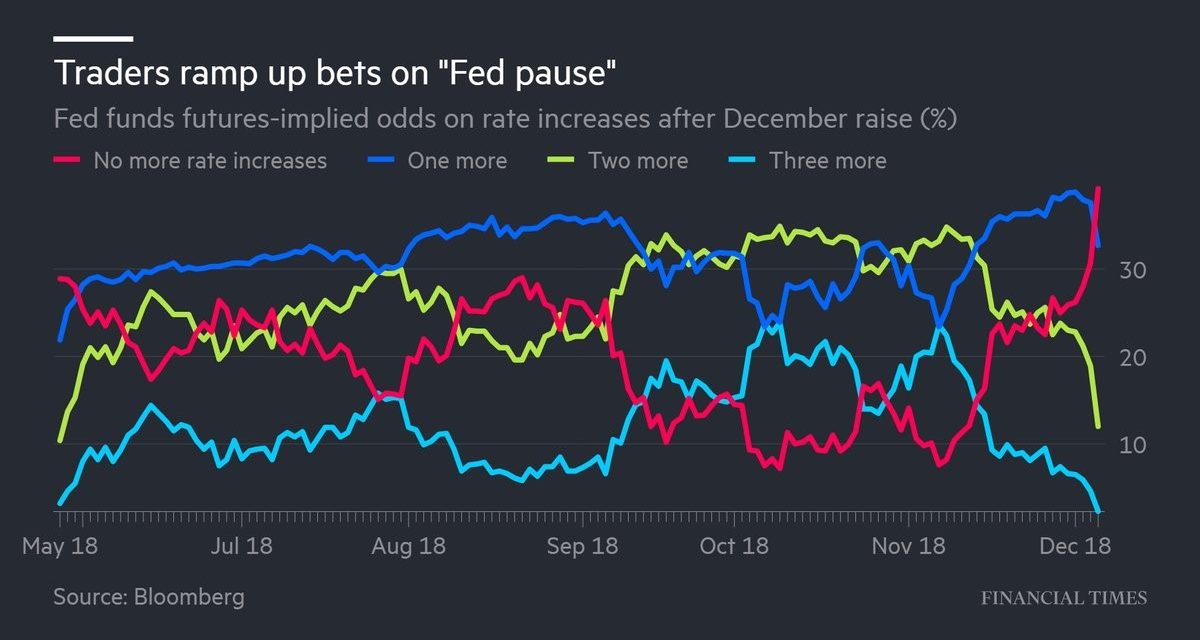
The Fed’s 2019 rate hikes are now in doubt after the volatility in stocks and the flattening of the yield curve. The Fed is still expected to hike rates in December as the Fed fund futures see a 74.9% chance of that. However, the market now doesn’t expect the Fed to hike rates at all in 2019 even though the Fed has guidance for 3 hikes. If the Fed keeps hiking rates in 2019, it will invert the curve as there is only a 14 basis point difference between the 10 year yield and the 2 year yield.
Source: Financial Times
In the past 2 cycles, the Fed has finished off its rate hikes after the difference between the 5 year yield and 2 year yield inverted. The Fed wants to hike rates because the labor market is strong and nominal wage growth has accelerated this year. That could be a mistake because wage growth isn’t causing inflation to increase as core PCE is only 1.8%. Real wage growth is finally about to occur at near full employment, and the Fed is trying to pursue a policy that will cause a recession.
Near Full Employment
As we mentioned, the labor market is near full employment. That is driving real consumption growth which helps GDP growth. With business investment growth slowing as the tariff benefits are wearing off and earnings growth is slowing, the economy needs consumption growth to be strong to have solid GDP growth. As you can see from the chart below, the percentage of prime aged men who aren’t working full time, but want to work full time is very close to the low from the year 2000.
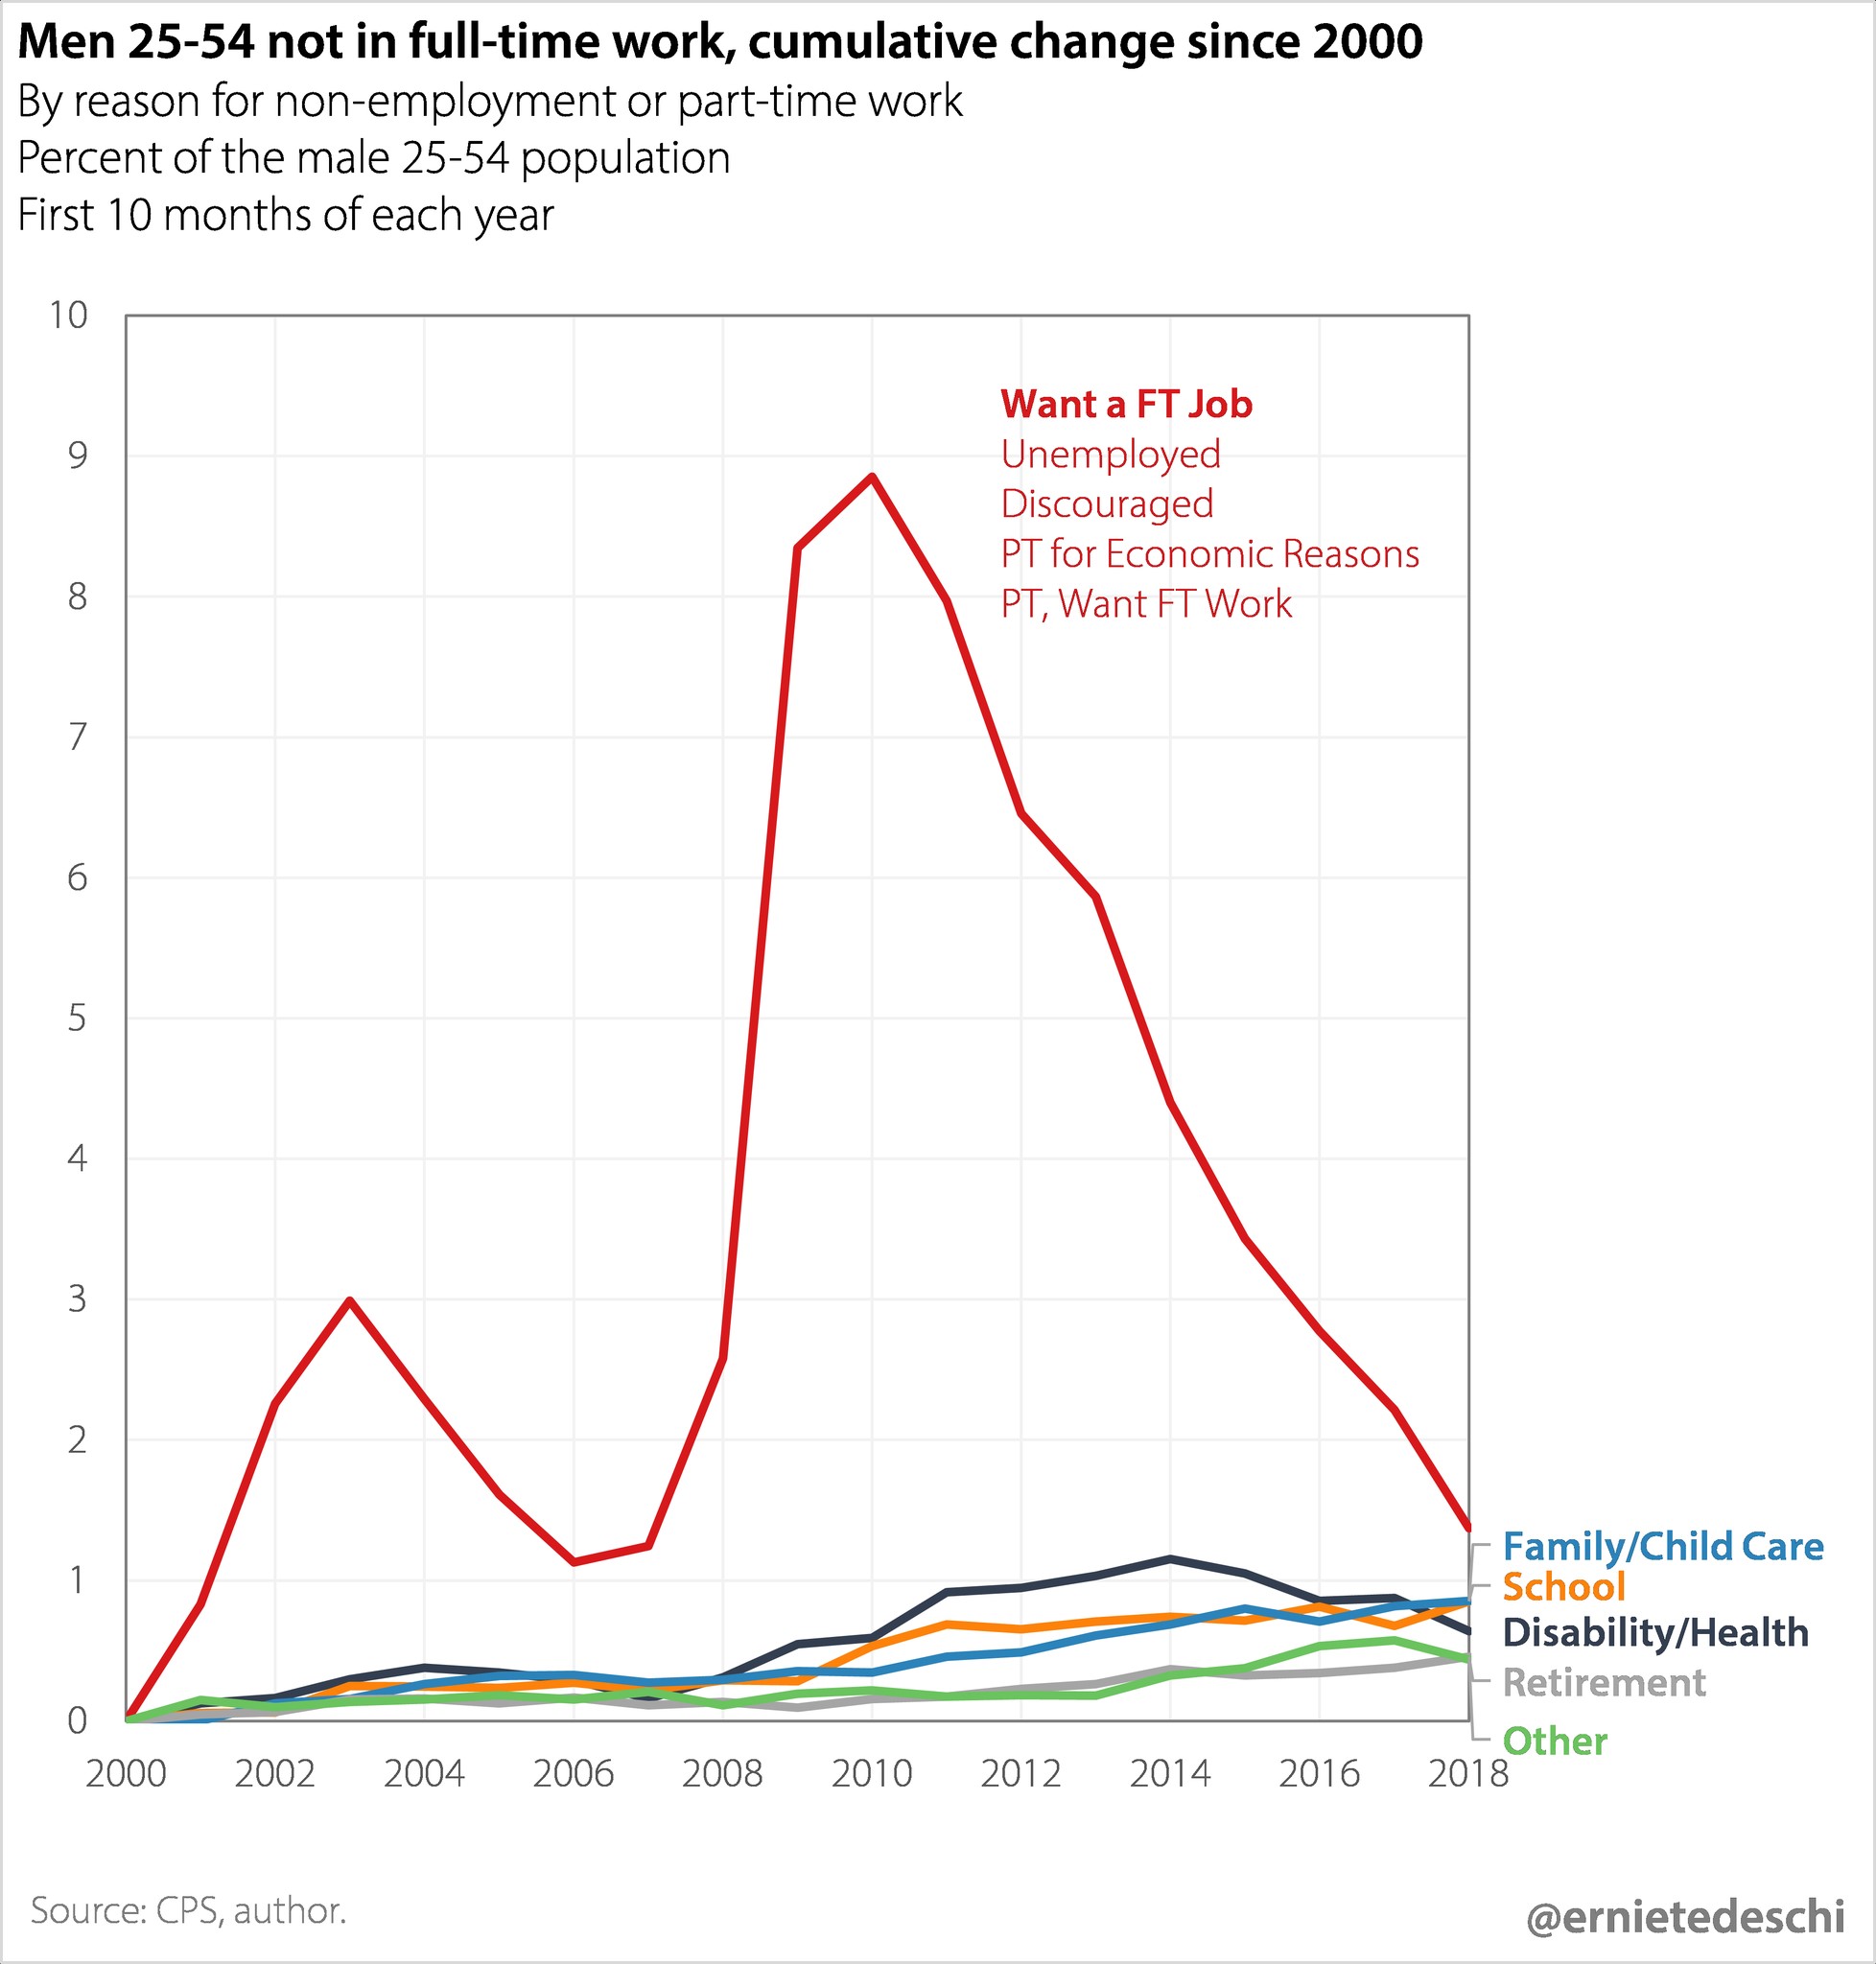
Source: Twitter @ernietedeschi
It’s even closer to the low from 2006. The situation is even better for prime aged women as it is even closer to the 2000 low. If the economy were to grow at its long run expected rate, the labor market could finally achieve full employment in 2019. If the Fed induces a yield curve inversion, that good circumstance won’t last long.
Strong ISM Reports
This cycle is different because the ISM reports are strong even as the yield curve is near inverting. Recessions happen over a year after the yield curve inverts, but by the time it inverts, growth is usually weakening. According to many hard data reports, growth has started to weaken. The median of Q4 GDP growth estimates is 2.8%. The November manufacturing and non-manufacturing ISM reports have been fabulous.
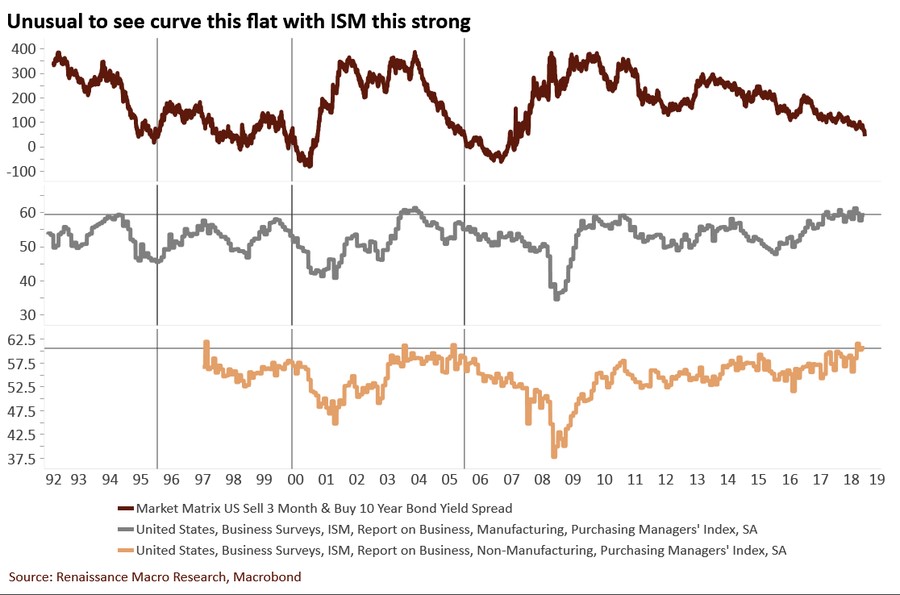
Source: Renaissance Macro Research
The manufacturing PMI is consistent with GDP growth of 4.9% and the non-manufacturing report is consistent with 4.3% growth. Those growth rates don’t make it seem like a recession is coming in 1-2 years. Maybe this signals a recession isn’t coming or maybe it just signals business sentiment is too high in relation to real growth.
Decent MBA Mortgage Applications Index
The MBA applications composite index was up 2% in the week of November 30th after increasing 5.5% in the previous week. The previous week was affected strongly by seasonal adjustments because it included Thanksgiving. The purchase index was up 1% on top of 9% growth and the refinance index was up 6% on top of 1% growth. The most interesting parts of this report were that the 30 year fixed mortgage rate fell 4 basis points to 5.8% and that the average loan size for purchase applications fell from $313,000 to $298,000 which is the lowest since December 2017. Lower rates may start encouraging buyers again. The weakness in loan values is probably because of the weakness in California which has expensive housing.
The charts below are very interesting because they show often overlooked points.
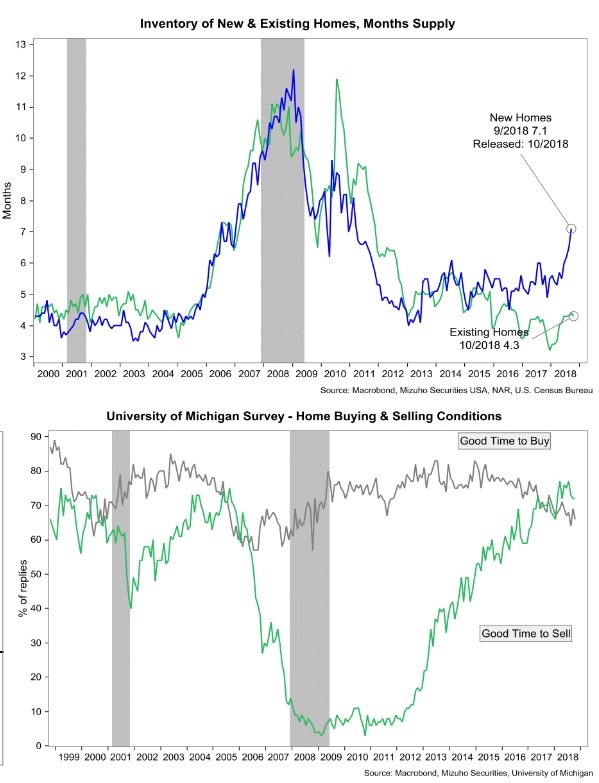
Source: Mizuho Group
The top chart shows new home inventory has spiked to 7.1 months like when the housing market started to weaken in 2006. However, unlike 2006 existing home inventories are low at 4.3 months. Existing homes are a bigger percentage of the market than new homes.
The 2nd chart shows the gap between those saying it is a good time to sell a house and those saying it is a good time to buy a house exceeded the gap in 2005 and 2006. According to this survey, buying conditions in relation to selling conditions are worse than the previous cycle. This implies mortgage rates falling a few basis points won’t be enough to bring back buyers.
Conclusion
The stock market volatility is being catalyzed by the uncertainty on trade and potential hawkish Fed policy. The labor market is nearing full employment and the November ISM reports were very strong. Mortgage rates are starting to come down again which might encourage demand. It will be interesting to see if the housing market can regain strength before the next recession which could occur in 1-2 years (based on the yield curve inverting soon).
Have comments? Join the conversation on Twitter.
Disclaimer: The content on this site is for general informational and entertainment purposes only and should not be construed as financial advice. You agree that any decision you make will be based upon an independent investigation by a certified professional. Please read full disclaimer and privacy policy before reading any of our content.


