UPFINA's Mission: The pursuit of truth in finance and economics to form an unbiased view of current events in order to understand human action, its causes and effects. Read about us and our mission here.
Reading Time: 5 minutes
Although the strong January consumer sentiment reading didn’t lead to a fantastic retail sales report, we still think it’s worthwhile to review the February report. Once again, the coronavirus didn’t hurt sentiment and the roaring stock market helped (coronavirus mentioned by 7% of consumers). The overall index was up from 99.8 to 100.9 which is only slightly below the expansion high set in March 2018 which was 101.4. The current conditions index fell from 114.4 to 113.8 and the expectations index rose from 90.5 to 92.6 (also the 2nd highest of this expansion). Each category rose substantially from its year ago reading because we are now lapping the weakness caused by the government shutdown.
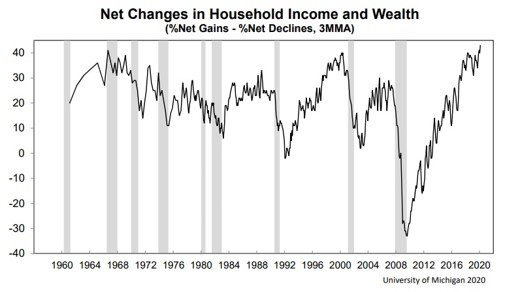
There were changes in both directions under the hood of this report. Personal finances and viewpoints on the economy increased sharply probably because of the rising stock market. However, buying conditions for household durables fell sharply. That’s not ideal for the February retail sales report. As you can see from the chart below, the net percentage change in household income and wealth rose to a new high. This includes data since 1960. It will be interesting to see if the election hurts consumer spending. In this report, 10% of consumers mentioned it. That percentage will likely go up as we get closer to the election.
Given the rise in household wealth, it’s no surprise consumers are very optimistic about the stock market. As you can see from the chart below, the median value of U.S. stock market investments has spiked to $197,258.
The percentage of consumers who think the stock market will increase in the next year rose to 66.3%. That’s slightly below the record high prior to the volatility in late January 2018 (dating back to 2002.) The good news is the AAII investor sentiment survey isn’t showing the same level of optimism as there are 3.3% more bulls than average and 4.1% fewer bears than average. Those aren’t extreme levels. The tiebreaker is valuations. The S&P 500’s forward PE ratio of about 19 is a bit stretched.
Education Drives Wages
The goal of policy makers is to raise household incomes. This goal is paramount at this point in the cycle because there is a pushback to the narrative that everything is fine for workers because the unemployment rate is low. Furthermore, inequality is highlighted because the stock market is soaring higher and about 50% of Americans don’t own stock.
There has recently been a push for tax free investing for the middle class. It’s basically the same as an IRA without the money being restricted from being taken out until around retirement age. This could motivate people to invest more, but plenty of workers already don’t need to pay capital gains taxes. Married couples with up to $78,700 in adjusted gross income qualify for 0% capital gains taxes. If you want more people to invest, it makes more sense to boost wages than to lower capital gains taxes.
The age-old question is if college is worth it. Obviously, this isn’t just about finances because if your lifelong goal is to have a career where an expensive college degree is necessary and you don’t earn a high wage, you should still reach for that goal if you can afford it. The biggest problem with finding the answer to this question is figuring out if the type of people who do go to college would be doing well anyway because of their actions and intellect. We don’t know the answer to that, but clearly, it makes sense for people who have the capability to go to college and know what they want to study to enroll.
The chart below shows as the educational attainment level increases, so do median and mean household incomes. Plus, those with a college education are less likely to lose their job in a recession. After the 2008 recession, the unemployment rate for those with a bachelor’s degree only peaked at 5%, while those without a high school diploma had an unemployment rate above 15%.
Recent Results Differ
Recently we’ve seen those with less education benefit from this tight labor market. For example, low wage industries have much higher wage growth than the average. As you can see from the chart below, since 1990 real median incomes of those who only graduated high school are down 9.8%, but they are up 11.2% since 2015. When the labor market is full, it’s especially good for those without much education.
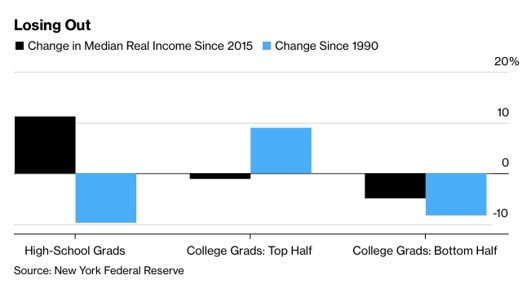
The chart also shows there is a bifurcation between the top and bottom half of college graduates in terms of wage growth. Since 1990, those in the 75th percentile had 9% real income growth and those in the 25th percentile had -8.4% real income growth. College only works out if it leads to a job that requires a degree. The good news is since the peak in October 2010, the percentage of recent college graduates with low wage jobs that likely don’t requite a degree fell from 15% to 12.9% (it’s up from 11.6% since June 2019 though).
There haven’t been gains for those with college degrees since 2015. In the 75th percentile, there has been a 1.1% decline in real incomes and for the 25th percentile there has been a 4.9% decline. This is related to there being excess degree holders. The unemployment rate of recent degree holders is 0.3% higher than the overall unemployment rate (3.88%).
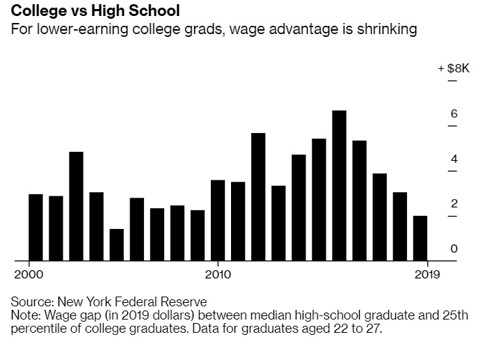
The point in the cycle benefits those with less education. As you can see from the chart below, the wage gap between the median high school graduate and the 25th percentile of college graduates fell from a peak of $6,700 at the end of 2015 to $2,000 at the end of 2019 (this uses data of people ages 22 to 27).
More Upper Income People
One of the tricky aspects of measuring income inequality is that there are an increasing number of people in the upper income category. The share of aggregate income of those who are in the upper income category rose from 29% to 48% from 1970 to 2018. However, there are more upper income people, so it’s not all bad news. The chart below shows the percentage of people making less than $50,000 per year in 2018 dollars has fallen and the percentage of people making $100,000 and over has increased.
Conclusion
Consumer sentiment was the 2nd highest of this expansion in February. Most consumers think stocks will rise, but investors are only modestly more bullish than average. People who have higher education have higher incomes and less volatility in unemployment. Recently, those with just a high school degree have outperformed college graduates. The upper income category has a much higher percentage of aggregate income, but that partially is because there are more people in that category.
Have comments? Join the conversation on Twitter.
Disclaimer: The content on this site is for general informational and entertainment purposes only and should not be construed as financial advice. You agree that any decision you make will be based upon an independent investigation by a certified professional. Please read full disclaimer and privacy policy before reading any of our content.


