UPFINA's Mission: The pursuit of truth in finance and economics to form an unbiased view of current events in order to understand human action, its causes and effects. Read about us and our mission here.
Reading Time: 5 minutes
Adding to the litany of economic reports that have caused the median Q2 GDP growth estimate to fall to 1.7% is the weak April construction spending report. Monthly growth was 0% which missed estimates for 0.4%. At least the March reading was revised higher from -0.9% to 0.1%. As the chart below shows, yearly growth fell from 0.5% to -1.2%. That’s the weakest yearly growth reading since June 2011. Negative growth usually means the economy is going into a recession or just coming out of one.
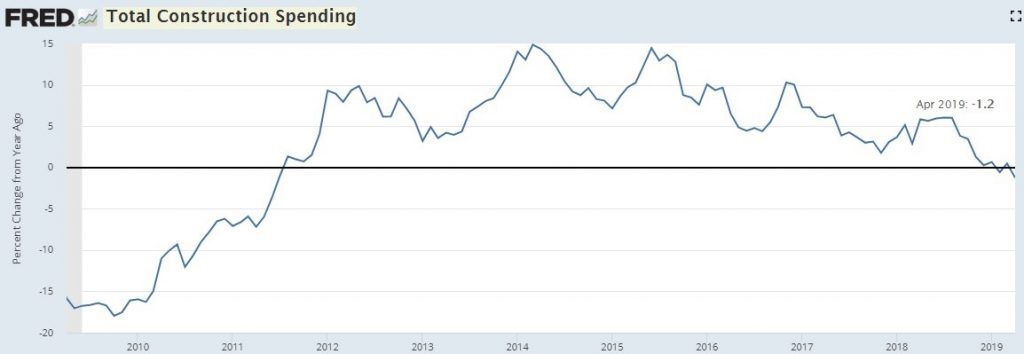
Private residential construction spending growth was -0.6% monthly and -11.4% yearly. Home improvement spending fell 2.5% monthly. Single family home spending was unchanged and multi-family spending was up 2.3%. Private non-residential spending was down 2.9% monthly and only up 0.6% yearly. There were huge gains in federal and state spending as on a year over year basis they were up 13.3% and 15.2%. So much for there not being an infrastructure spending bill. Spending was led by highways and streets as well as educational buildings. Improved government spending does nothing to allay fears of a cyclical slowdown in the private sector.
Wild Fed Funds Futures Market
The Fed funds futures market has been expecting more and more rate cuts each week. It has gotten to the point where the market expects 2 cuts this year, but the Fed hasn’t guided for any yet. Specifically, Fed chair Powell commented on the trade negotiations saying,
“We do not know how or when these issues will be resolved. We are closely monitoring the implications of these developments for the U.S. economic outlook and, as always, we will act as appropriate to sustain the expansion, with a strong labor market and inflation near our symmetric 2 percent objective.”
His speech didn’t have a dovish tone like Bullard’s had. However, it’s notable that he never mentioned the word ‘patience’, which was a key point in the last Fed statement. If the Fed says it is patient, it means no rate cuts or hikes are coming soon. There’s no need for Powell to box himself into a corner like that since the market is widely expecting the Fed to guide for cuts at its June 19th meeting. It’s important to be aware of the fact that Fed members make different points to see how the market will react. Powell differing from Bullard shouldn’t be a surprise.
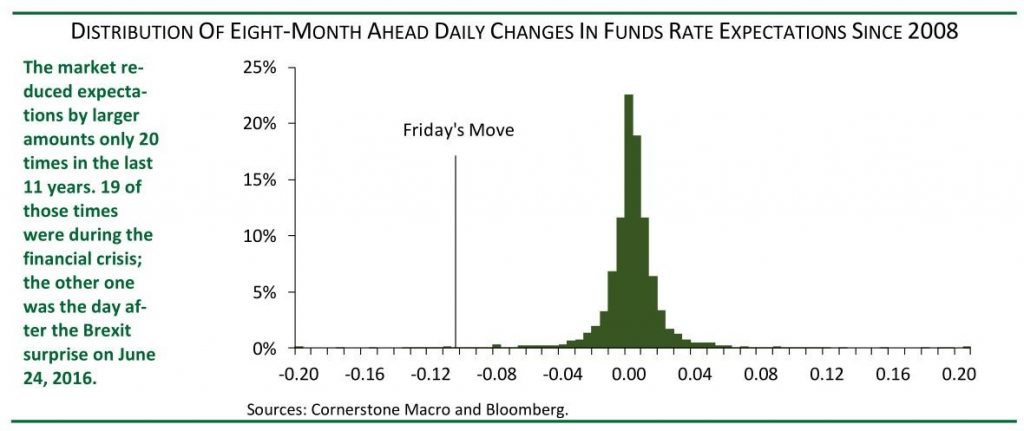
As you can see from the chart below, the recent move in Fed funds rate expectations on Friday was a very rare event because of the big increase in expected cuts. The market has lowered its expectations for the Fed funds rates quicker than Friday only 20 times since 2008. Out of those 20 times, 19 were during the financial crisis and the other one was the day after Brexit.
Inversion Signals Recession
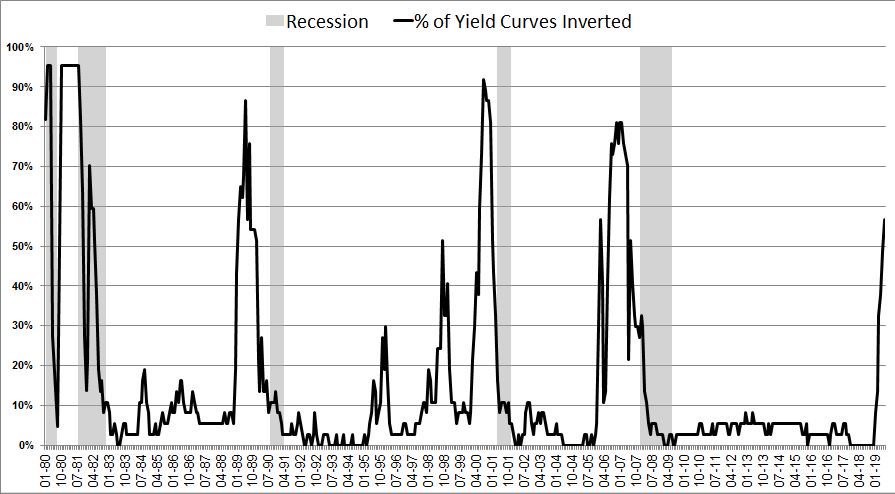
We look at the whole yield curve instead of just one section. As you can see from the chart below, over 50% of the yield curve has inverted which is a clear recession warning.
Since 1980, this percentage of inversion has always meant a recession was coming in the next couple years. The bulls love to point out that the near maturity part of the yield curve is inverted because the Fed is widely expected to cut rates. However, recent cycles show rate cuts signal a recession is coming soon.
The bulls hope the Fed will cut rates once or twice this year to help the economy exit this slowdown. However, one of the catalysts of a potential recession is the trade war. One rate cut won’t stop the trade war from raging on. The trade war ending is probably the bulls’ best bet to avoid history repeating itself. In theory, if rate cuts are already expected, they shouldn’t cause stocks to rally when they occur. Stocks rallied on Tuesday after Powell spoke, but the Fed futures market didn’t move much which suggests his speech didn’t cause the rally. Stocks had entered the day very oversold.
Tariffs Hurt America
The tariffs are a big deal because they create uncertainty. You can’t blame the experts who predicted the trade war wouldn’t get this far because some of the actions have been unpredictable. It’s easy to say the administration was always in favor of tariffs, but most politicians can have their speeches cherry picked to support anything. You can easily craft a narrative which suggests the US wanted to make a deal with China quickly.
JP Morgan has done research which suggests the tariffs are hurting non-Chinese businesses more than Chinese firms. As you can see from the table below, the recent tariffs are mostly hitting multinational supply chains.
In the machinery, computers, electrical equipment, and miscellaneous manufacturing industries, the products exported to America mostly come from U.S. and other non-Chinese companies located in China.
Leading Indicators Might Suggest Weak Performance
The chart below shows the annualized stock market performance based on yearly and monthly growth in the leading indicators index.
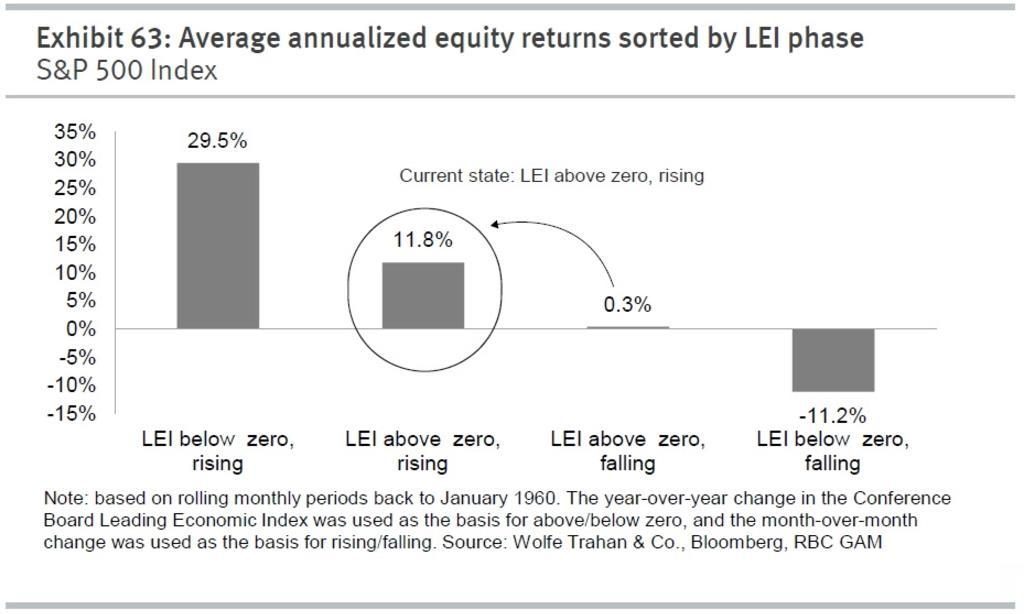
The April reading had positive yearly and monthly growth which puts it in the 11.8% return category. The May index comes out on June 20th. The decline in the stock market will weigh on this index. Even though the manufacturing ISM PMI was weak, the new orders index was up 1 point and that’s what’s included in the leading indicators index. The spread between the 10 year bond yield and the Fed funds rate will be a big negative for this index. Let’s see if it has monthly growth in May.
Conclusion
The construction spending report was weak. The Fed funds futures market is moving very quickly towards expecting two rate hikes this year even though Powell didn’t suggest rate cuts are coming soon. He didn’t use the word ‘patience’ which increases the Fed’s optionality in terms of cutting rates this year. The yield curve is mostly inverted which increases the probability of a recession. The tariffs are hurting non-Chinese companies more than Chinese companies. Finally, if the stock market and the 10 year Fed funds rate differential pushed the leading index lower on a monthly basis in May, it will move into the category that is consistent with just 0.2% annualized S&P 500 returns.
Have comments? Join the conversation on Twitter.
Disclaimer: The content on this site is for general informational and entertainment purposes only and should not be construed as financial advice. You agree that any decision you make will be based upon an independent investigation by a certified professional. Please read full disclaimer and privacy policy before reading any of our content.


