UPFINA's Mission: The pursuit of truth in finance and economics to form an unbiased view of current events in order to understand human action, its causes and effects. Read about us and our mission here.
Reading Time: 5 minutes
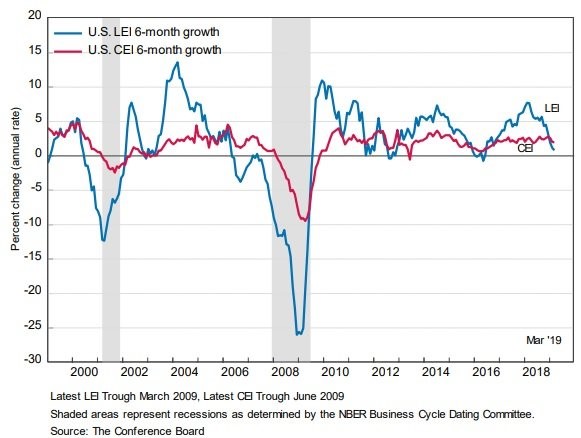
The ECRI leading index’s yearly growth rate in the week of April 12th increased to 1.2% from 0.2% as it inches closer to its record high. This index is clearly being helped by the stock market. It has a great track record, so don’t scoff at that contribution. It’s starting to show us the possibility of an economic growth turnaround late this year into early next year.
The March Conference Board leading index’s monthly growth rate of 0.4% beat estimates for 0.3%. It was driven higher by financial conditions, consumer expectations, and jobless claims. Even though the report looked solid on a monthly basis, the Conference Board stated “growth in the US economy is likely to decelerate toward its long term potential of about 2 percent by year end.” That slightly bearish tone is supported by the chart below as the leading index’s 6 month growth rate is barely positive and it’s below the coincident indicator’s growth rate.
Industrial Production
There’s a huge difference between industrial production and industrial stocks. 93% of industrial stocks are above their 50 day moving average, but yearly industrial output growth in March fell to 2.8% which was a 10 month low. Also, manufacturing production growth was only 1%. Investors in industrial stocks are keying off a potential turnaround in China and a potential trade deal. They aren’t worried about weak results back in March. However, traders should keep in mind, the April Empire Fed and Philly Fed manufacturing 6 month expectation indexes fell as well. The Empire Fed index fell from 29.2 to 12.4 which is the lowest reading in over 3 years. The Philly Fed index fell from 21.8 to 19.1.
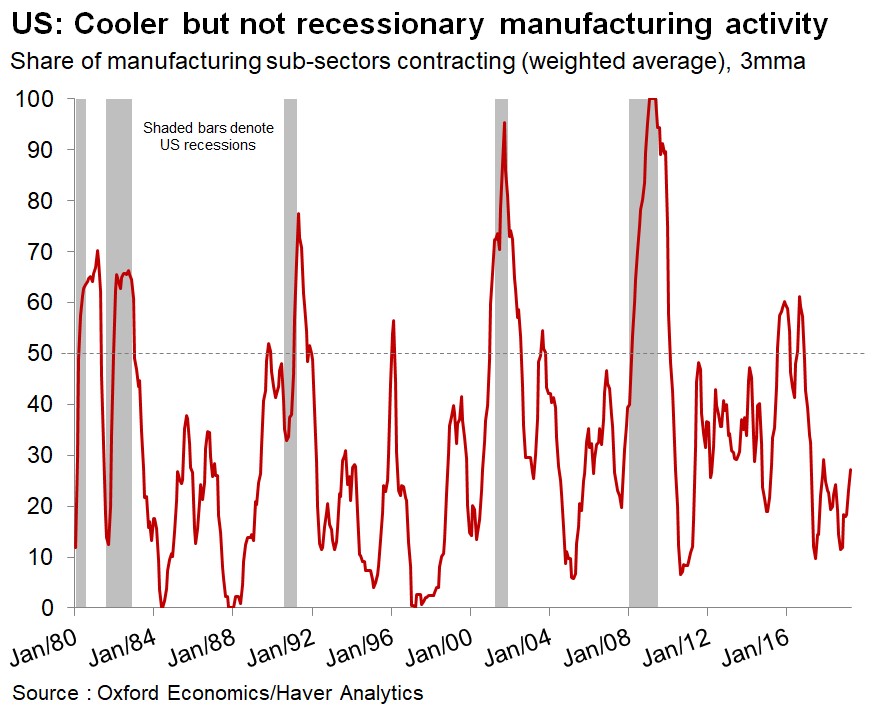
We still follow hard data reports like industrial production even if it looks like the market doesn’t care. Manufacturing’s Q1 seasonally adjusted annual growth rate was -1.1% which was the weakest growth since Q3 2017. Industrial production was down 0.3%. On a monthly basis, utilities and mining were up 0.2% and down 0.8%. Durable goods were hurt by the 2.5% monthly decline in vehicle production. It was down 4.5% yearly. Even with this mostly weak report, the chart below shows the weighted 3 month average of manufacturing sub-sectors that are contracting isn’t elevated. That’s because manufacturing is still growing. Growth is just much weaker than it was last year. This probably isn’t a manufacturing recession yet.
Fabulous March Retail Sales
So much for Redbook’s mini-growth decline. The March retail sales report was fantastic, especially the all-important core results. Monthly headline retail sales growth was 1.6% which doubled expectations. Monthly control group retail sales growth was 1% which also doubled expectations. This solid result is partially why the median GDP growth estimate for Q1 increased to 2.4%. If growth hits that level, this is a shallow slowdown.
As the chart below shows, this growth wasn’t only because of weak monthly comps as yearly core retail sales growth spiked to 3.6%.
Even though vehicle production was weak in the industrial production report, auto sales growth on a monthly basis was 3.1% and it was 3.8% yearly. On a monthly basis, furniture and home furnishing sales were up 1.7%. That’s after the industrial production report stated furniture production fell 0.8% monthly. Clothing sales were up 2%, online sales were up 1.2%, and restaurant and bar sales were up 0.8%, all monthly. Department store sales were flat and the broader general merchandise sales category had 0.7% growth. They lost share to online again.
Housing Market Update
The housing market is having a solid spring selling season as MBA purchase applications in the week of April 12th were up 1% weekly on top of 1% growth. Year over year purchase applications were up 7%. The 4 week moving average is up 7.75%. As the chart below shows, in the past 10 years, there have only been 2 better weeks for applications.
This chart highlights the importance of the spring selling season since the data isn’t seasonally adjusted. As you can see, the peaks are usually in the spring.
The housing market index is a sentiment index for home builders. In April it increased from 62 to 63 as homebuilder optimism is trying to recover from the big decline it had late last year. Current sales were up 1 to 69 and expected sales were down 1 to 71. Traffic was up 3 to 47 which signals traffic fell at a lower rate. It still means the first time home buying market is weak as there is more traffic to lower priced houses. Regionally, the West was the best at 69. The South, which is the biggest market, is at 67. The Northeast and the Midwest were at 51 and 53 signaling every region saw growth.
Healthcare Sector Plummets
As you can see from the chart below, the healthcare sector is plummeting.
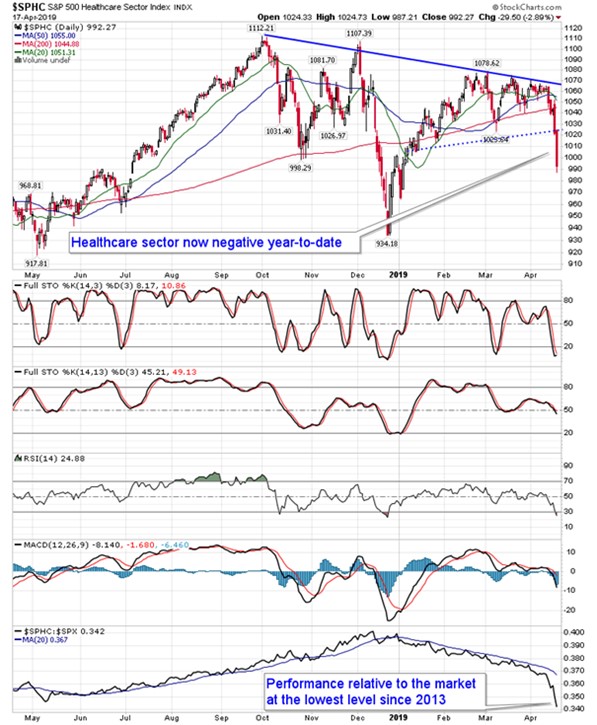
The performance relative to the market is the worst since 2013 as the S&P 500 is up in the mid double digits and the healthcare sector is flat/down.
Investors are worried about the Medicare for All proposal by the left wing of the Democratic party. Senator Bernie Sanders introduced this act with 16 other Senators in 2017. United Health’s CEO stated it would “destabilize the nation’s health system.” It has no chance of passing unless a left wing President is elected and the Democrats take the Senate (and House). Currently, Biden is ahead of Sanders by 7.5% in the average of recent polls. Medicare for All is still far away from being passed.
In the 2020 race, the GOP will have 22 Senators up for re-election and the Dems will have 12. The map is better for the Dems than in 2018, but now they are starting with the Senate at 53-47 in favor of the GOP. According to the Cook Political Report, there are 3 races which lean GOP that the Dems could pick up. However, there is one Dem seat that’s a tossup that the GOP could easily pick up.
Conclusion
The ECRI leading index is more updated than the Conference Board index which means it’s possible the Conference Board index starts to forecast growth acceleration in late 2019 in future reports. The industrial production report was weak, but not recessionary. Retail sales growth is rebounding nicely, supporting calls for above 2% GDP growth. The housing market is improving as it is being helped by low rates. The healthcare sector is underperforming the market because of political worries. The worries might be overdone.
Have comments? Join the conversation on Twitter.
Disclaimer: The content on this site is for general informational and entertainment purposes only and should not be construed as financial advice. You agree that any decision you make will be based upon an independent investigation by a certified professional. Please read full disclaimer and privacy policy before reading any of our content.


