UPFINA's Mission: The pursuit of truth in finance and economics to form an unbiased view of current events in order to understand human action, its causes and effects. Read about us and our mission here.
Reading Time: 5 minutes
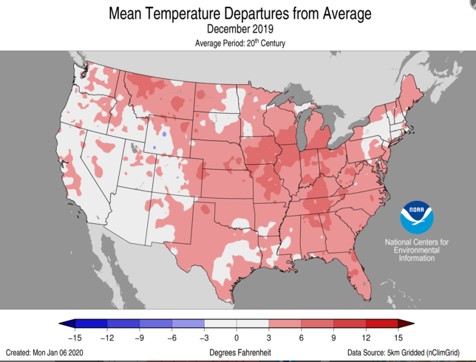
Investors are predisposed to ignore weather as an excuse for bad earnings. However, in some cases highly unusual weather patters impact economic data in a way that must be accepted as a one time event that doesn’t imply a cyclical phase change. The most obvious is during hurricanes motor vehicle sales fall and then in the month following the storm sales increase because cars that were destroyed need to be replaced. This past December was a historically hot month which led to an increase in housing starts and a decrease in utilities production. Before we get to those reports, let’s look at the weather.
As you can see from the map below, most of the country had above average temperatures. That trend was pronounced in the Midwest and the South.
The South is the nation’s largest housing market. That explains the big boost in housing starts. Specifically, this was the 6th warmest December in 125 years. Temperatures were much above average in 9 states, 7 of which are in the South.
A Continuation Of The Industrial Production Slowdown
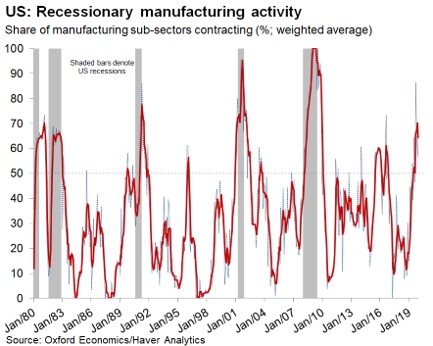
December industrial production growth met estimates and manufacturing growth beat them, but November’s growth was revised lower. Growth was hurt by motor vehicle and parts production and utilities production (because of the warm weather). As you can see from the chart below, the 3 month weighted average of the percentage of manufacturing sub-sectors contracting fell, but sequentially the percentage rose. Specifically, monthly the percentage of sub-sectors in recession increased from 56.6% to 68.9%. Because September’s reading of 86.6% was no longer in the 3 month average, it fell.
A Breakdown Of Industrial Production
Monthly industrial production growth was -0.3% which met estimates. November’s growth was revised from 1.1% to 0.8%. This still tough comp partially explains why growth was negative. Monthly manufacturing growth was 0.2% which beat estimates for -0.2%. Just like in the overall report, November’s growth was revised lower; it fell from 1.1% to 1%. November’s capacity to utilization rate was revised down from 77.3% to 76.6%. December’s reading of 77% missed estimates by 0.1%. Capacity to utilization was down 3.1% yearly. This was the 9th straight month it fell. The expansion peak was 79.6% in November 2018.
Yearly industrial production growth fell from -0.7% to -1%. The comp got easier by 0.3% (4.1% to 3.8%) which means the 2 year growth stack fell 0.7%. In the manufacturing recession of 2015 to 2016, yearly industrial production growth was negative for 20 straight months. Growth has been negative for 4 straight months in this slowdown. The trough was in October at -1%. This slowdown won’t be as deep as the last one (-4.1%) because oil prices didn’t crash like they did in 2014 and 2015.
Motor vehicle and parts production growth was weak just like in the retail sales report. Yearly motor vehicle and parts production growth was -8.3% which fell from 0%. This was the 2nd lowest yearly growth since the start of this expansion. The lowest growth was in October when it fell to -10.8%. The only good news is December had a very tough comp as growth was 8.5% last December. Automakers are expecting a weaker 2020.
Yearly manufacturing production growth fell from -0.9% to -1.3%. Unlike industrial production, this 2 year growth stack actually increased 0.2% because of a tougher comp. Finally, electric and gas utilities production was weakened because of the warm temperatures. Yearly growth actually increased from -3.2% to -1.9%. However, monthly growth was -5.6%.
Housing Market Index Ticks Lower From 20 Year High
The January Housing Market index fell 1 point to 75 which met estimates. December’s index of 76 was a 20 year high which explains why this slight decline doesn’t imply this was a weak report. It’s interesting to review the underlying numbers because there were some unusual movements in December. Many of them corrected. After the present sales index rose 7 points in December, it fell 3 points to 81. The 6 month expected sales index stayed at 79. The traffic index rose 1 point to 58 which is the highest reading in at least a year.
Last month’s regional changes reversed. The Northeast’s index increased 3 points following a decline of 5. The Midwest’s index fell 7 points following a very usual 15 point increase. The South stayed at 77. The West rose 4 after declining 3. It’s possible the spike in the Midwest’s index in December was bolstered by the warm weather.
Highest Housing Starts In 13 Years
Housing starts were bolstered by the warm weather in December as we mentioned earlier. Starts increased from 1.375 million to 1.608 million. As you can see from the chart below, this was the 3rd largest positive surprise ever.
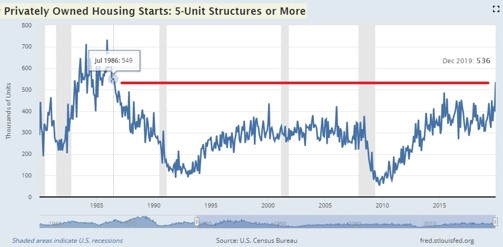
This was the most starts since December 2006. On the other hand, don’t think that starts are historically high because of this one report. As you can see from the chart below, 1982 and 1991 are the only 2 years starts were lower than they were in 2019 (prior to 2008). Housing permits fell from 1.474 million to 1.416 million which missed estimates for 1.458 million. Permits usually lead starts, so this implies starts will come back down to Earth. That didn’t stop the Atlanta Fed Nowcast from increasing its Q4 estimate for real residential investment growth from 4.3% to 5.5%.
Starts were up 16.9% monthly. We won’t even mention yearly growth because the comp was very easy. Single family starts were up 11.2% as they were the highest since June 2007. As you can see from the chart below, privately owned 5+ unit structures had starts rise from 406,000 to 536,000 which was the most since July 1986. Apartment demand has increased because of millennials who are moving to cities.
Housing Price Growth Increases
The Case Shiller and FHFA housing price reports only have data as of October. That’s why it’s nice to look at Redfin’s data which now includes December. As you can see from the chart below, yearly home price growth was 6.9% in December which is the highest growth rate in 19 months.
Growth peaked at 9% in February 2018 which led to the housing downturn in 2H 2018. Price growth troughed in February and March of 2019 at 1.5% which helped housing rebound in 2H 2019. This latest increase in price growth might limit demand. The good news is rates have stayed low. Price growth increased because inventory fell 15% from last year. Inventories fell to the lowest level since December 2012. The increase in housing starts in December will increase supply.
Conclusion
The industrial production report was more of the same. The mini-recession/slowdown continued. At least it didn’t get worse. The Empire Fed and Philly Fed reports imply a rebound in January is coming. The housing market is heating up even if you exclude December’s spike in starts. The spike in starts will help real residential investment growth in the Q4 GDP report.
Have comments? Join the conversation on Twitter.
Disclaimer: The content on this site is for general informational and entertainment purposes only and should not be construed as financial advice. You agree that any decision you make will be based upon an independent investigation by a certified professional. Please read full disclaimer and privacy policy before reading any of our content.


