UPFINA's Mission: The pursuit of truth in finance and economics to form an unbiased view of current events in order to understand human action, its causes and effects. Read about us and our mission here.
Reading Time: 4 minutes
The obvious question many readers probably have when they see our articles state that the economy is only showing some signs of potentially bottoming while markets are pricing in a full recovery is “what gives investors so much confidence?”. The answer is global rate cuts.
The clear reason investors are so confident that some small improvements in the economy will lead to a global synchronized expansion in 2020 like 2017 is the global synchronized monetary stimulus shown in the chart below.
In Q3 almost 60% of global central banks were cutting rates. That’s the highest percentage since the end of the last recession. It’s even higher than at any point during or after the 2001 recession. If you remember, in early 2016 global central bankers gathered to figure out how to stimulate the economy. The resulting action was more about balance sheet expansion globally, and specifically in China; this one is more about rate cuts (for now). It’s tough to compare the two.
Some Green Shoots?
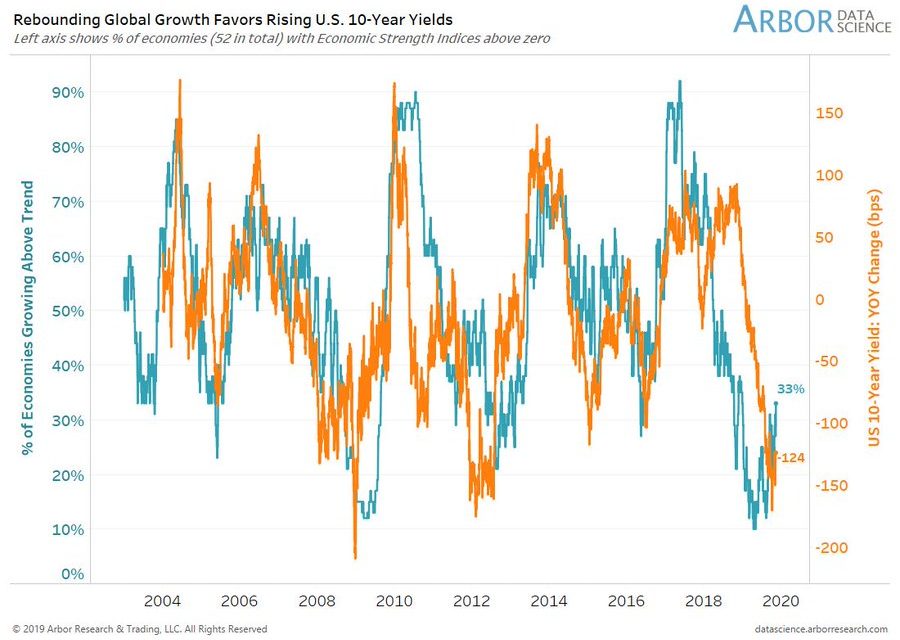
By saying global central banks have helped catalyze this rally in global stocks, we aren’t saying these gains aren’t real or that the cyclical turnaround won’t happen. We don’t hold a cynical view of every monetary policy action. Regardless of whether we agree or disagree with some policy action, the goal here is to make money, not policy opinions. The chart below shows there might be some upward potential in the global economy as the percentage of economies growing above trend has risen from about 10% to 33%.
It’s interesting to see that at the recent bottom fewer economies were growing above trend than in the depths of the 2008 financial crisis. This percentage includes 52 total economies. The chart shows the percentage’s relationship with the 10 year yield’s yearly change. The 10 year yield will keep increasing if the global cyclical turnaround is real.
Looking at the latest economic data, Germany avoided what some economists call a technical recession because GDP growth was +0.1% in Q3 following the decline in the previous quarter. Two straight negative GDP growth quarters isn’t a recession, so this beat is less dramatic than it sounds. However, beating estimates by 2 tenths is still a positive.
China’s economic data wasn’t as pleasing. Industrial production growth was 4.7% in October which missed the median estimate for 5.4%. Fixed asset investment growth in the first 10 months of 2019 was 5.2% which missed estimates by 0.2%. This was the slowest growth since it started being tracked in 1996. Private sector fixed investment growth in this same period was only 4.4%. Finally, retail sales growth was 7.2% which missed estimates for 7.9% matching the 16 year low hit this April. Auto sales fell for the 16th straight month. It’s clear, China won’t be leading the global economy higher in 2020 like it did in 2010 or in 2016.
Headline Inflation Increases And Core Inflation Falls
The October CPI report showed there was 1.8% headline inflation which beat estimates and the prior reading of 1.7%. There was 2.3% core CPI inflation which fell from 2.4% which also the September reading. The decline isn’t as large as it sounds though as it fell 4 basis points to 2.32%. That’s the 2nd straight decline. The comp was easier so the 2 year growth stack fell 6 basis points. The November comp gets 9 basis points harder and then the following 4 months of comps get easier. There are slightly fewer complaints from skeptics of monetary stimulus because the core CPI rate is falling and the Fed isn’t planning to cut rates in December. In fact, there is only a 44.6% chance of any cuts next year.
The charts below show why median yearly CPI and the quarterly average of core CPI may have peaked even though easier comps are coming. The first chart uses the NY Fed’s underlying inflation gauge to predict lower yearly median CPI in the next 15 months. This has an R squared of 65.3%. The bottom chart uses yearly GDP growth to predict quarterly core CPI for the next 6 quarters. This has an R squared of 67.1%.
Big Underlying Changes To Inflation
The core and headline CPI inflation data points make it seem like there weren’t many changes in this report, but there actually were. Firstly, the difference between core and headline CPI fell from 0.7% to 0.5%. That’s because energy inflation increased from -4.8% to -4.2%. That’s despite the comp going from 4.8% to 8.9%. The comp is November is 3.1% which means the gap will close further.
The headline of this inflation report is that shelter inflation fell and medical care services inflation soared. Shelter inflation fell from 3.5% to 3.3% which is a big deal because of its high weighting. Primary rent inflation fell from 3.83% to 3.74% and owner’s equivalent rent inflation fell from 3.4% to 3.32%. These declines and the weakness in lodging away from home inflation mitigated the impact of the spike in medical care services inflation. Hospital services inflation rose from 2.08% to 3.46%. Health insurance inflation increased from 18.8% to 20.1% which is the highest reading since at least 2008. This caused medical care services inflation to increase from 4.4% to 5.1% which is the highest rate since August 2016. Those two are joint cycle highs.
Conclusion
Central banks have done coordinated rate cuts which have gotten investors excited about a potential 2020 synchronized expansion. We might already be seeing the beginning signs of this occurring. On the other hand, inflation might have peaked. Shelter inflation was the lowest since May. Medical care services inflation certainly isn’t moderating as it was the highest of this cycle due to the big increase in insurance inflation.
Have comments? Join the conversation on Twitter.
Disclaimer: The content on this site is for general informational and entertainment purposes only and should not be construed as financial advice. You agree that any decision you make will be based upon an independent investigation by a certified professional. Please read full disclaimer and privacy policy before reading any of our content.


