UPFINA's Mission: The pursuit of truth in finance and economics to form an unbiased view of current events in order to understand human action, its causes and effects. Read about us and our mission here.
Reading Time: 4 minutes
In this section we will mention some of the points from the April labor report that we didn’t get to in the last article. The length of the work week rose from 34.9 to 35 hours. That tied the record high using data that goes back to March 2006. Weekly hours worked by private production & non-supervisory workers goes back further. It stayed at 34.4 hours which tied the highest reading since April 2000. From the 1960s to the 2010s, there was a multi-decade decline in hours worked per week.
The recent spike is related to the limited workforce supply. Certain industries have job shortages. Furthermore, people are hesitant to re-enter the workforce until the pandemic is fully over. Once this hesitancy goes away (potentially with the end of federal unemployment benefits this September), these shortages will be alleviated. There has been a massive decline in COVID-19 cases in the US in the past 30 days. On April 11th, the 7 day average of new cases was 69,575. As of May 10th, the 7 day average was 39,124. There is no exact threshold we can point to where people will go back to normal. We’re definitely closing in on whatever that point is.
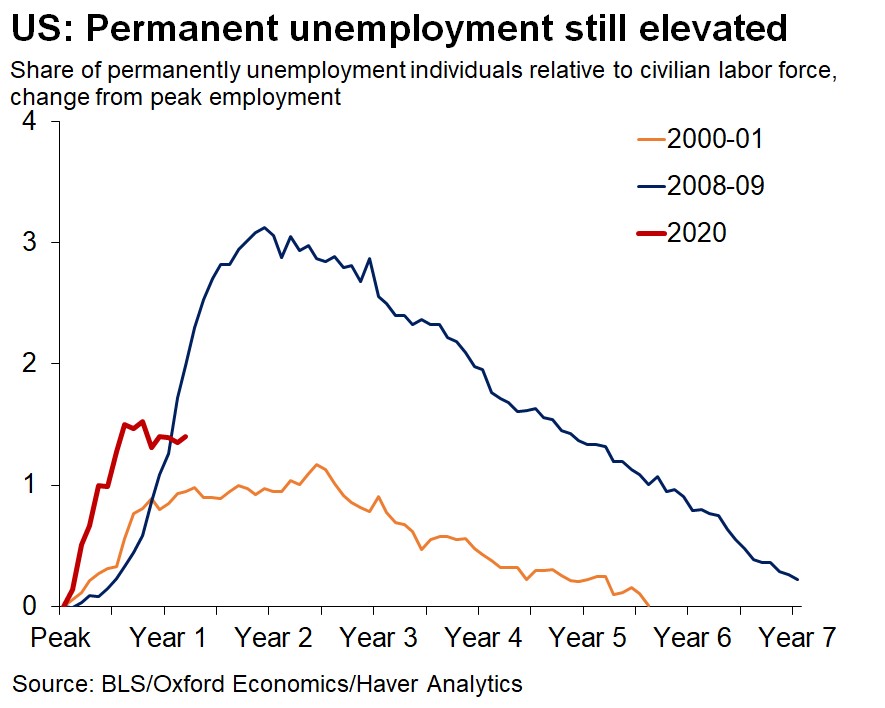
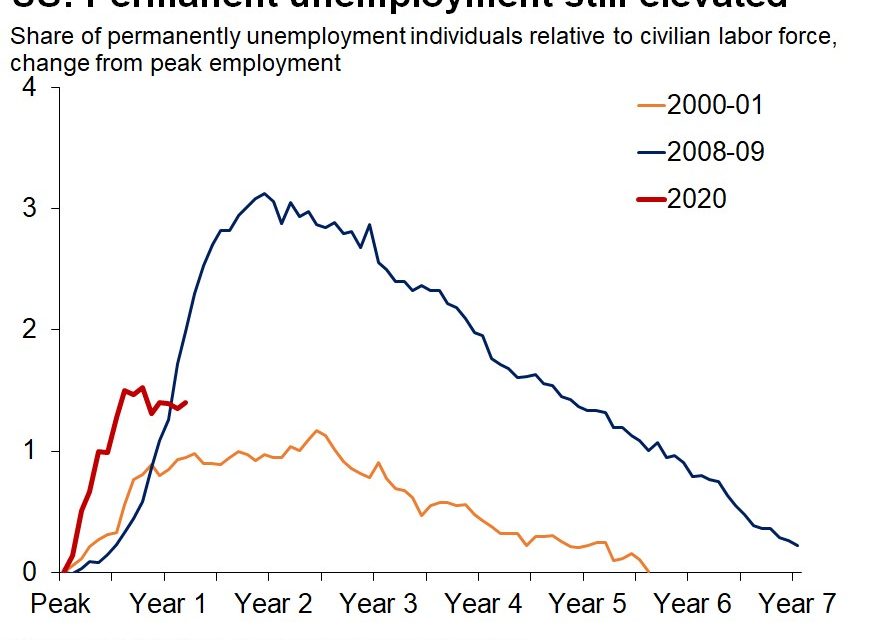
We have been heavily focused on temporary and permanent job losses in this recession/recovery because the pandemic catalyzed a lot of temporary job losses which, in theory, could come back after the environment normalizes. There were over 8 times the number of temporary losers as ever before. Ultimately, the normalization process should take about 16 months. On the one hand, that’s a long time to be temporarily estranged from your employer. On the other hand, if you have been estranged for 13 months, what difference will a few more months make?
Specifically, there were 2.114 million people temporarily laid-off in April which was up slightly from March which had 2.026 million. Keep in mind, these are very elevated numbers. The peak following the past recession was 1.894 million in 2009. It will be interesting to see how quickly these temporary layoffs fall this summer. As you can see from the chart above, the number of permanent losers rose from 3.432 million to 3.529 million. Remember, we already predicted that this reading peaked in November 2020. That’s looking slightly more precarious, but we think permanent layoffs will fall in the next year as the labor market fully recovers.
Job Openings Spike To A Record High
There is currently extreme dislocation in the labor market. Companies are desperate for workers, but the unemployment rate is still elevated. Some people don’t want to go back to work until their kids go back to school. Unfortunately, just as all students are able to go back, the summer will start. Maybe we will see high job creation in August and September as the school year finally starts at a normal time in person.
Furthermore, people with other health complications don’t want to risk getting COVID-19 until the pandemic is over. Many employers are forcing workers to come back to the office this summer. Workers don’t want to go back mainly because of convenience, but some still fear the virus even after getting vaccinated.
You can see the extreme dislocation in the chart above. Job openings rose from 7.526 million to 8.123 million in March which was by far a record high. This beat estimates for 7.455 million and the highest estimate which was 7.5 million. In March, employers were strongly demanding workers, but that didn’t convert into hiring. The number of hires rose from 5.794 million to 6.009 million which was the highest reading since November.
As you can see from the chart below, the ratio of hires to openings fell to a record low.
There had been a long term decline in this job filling rate prior to the pandemic. While that’s the case, this isn’t just an extension of the trend. Once, the pandemic is over, hires will increase quicker than openings. The elevated number of openings suggests the labor market is primed to create millions of jobs when the pandemic is over. We can easily see a huge spike in job creation this summer (a couple months later than we initially expected). The April jobs report was either an outlier or it needs to be revised higher. The cyclical labor market recovery is still on solid footing.
Slight Improvement In Small Business Confidence
The small business confidence index rose from 98.2 to 99.8 in April. The plans to make capital outlays index was up 7 points to 27%. The earnings trends index was up 8 points to -7%. Economic activity is rebounding quickly (even though there was a 7 point decline in those expecting the economy to improve). You know inflation is ramping when the prices index is the most interesting part of most economic reports.
As you can see from the chart below, the net percentage of small businesses saying they raised prices minus the percentage saying they cut them was the highest since the 1970s. It rose 10 points in April.
While this index is similar to the 1970s, that doesn’t mean inflation will reach the double digits. This is a diffusion index. A lot of companies are raising prices because input costs are up. However, these costs aren’t up nearly as much as they were in the 1970s. The April CPI report comes out on Wednesday. Estimates are for headline CPI to rise from 2.6% to 3.6% and for core CPI to rise from 1.6% to 2.3%. Finally, core CPI will be above the Fed’s target.
Conclusion
Permanent unemployment rose in April, but the BLS report was a blip. Job openings are spiking much quicker than hires which signals high dislocation in the labor market. Hiring will spike once the pandemic is over this summer. The highest net percentage of small businesses are raising prices since the 1970s. The April CPI report will show core inflation rose above the Fed’s target for the first time in this expansion. The Fed won’t turn hawkish because of this. They will call it transitory.
Have comments? Join the conversation on Twitter.
Disclaimer: The content on this site is for general informational and entertainment purposes only and should not be construed as financial advice. You agree that any decision you make will be based upon an independent investigation by a certified professional. Please read full disclaimer and privacy policy before reading any of our content.


