UPFINA's Mission: The pursuit of truth in finance and economics to form an unbiased view of current events in order to understand human action, its causes and effects. Read about us and our mission here.
Reading Time: 5 minutes
Investors are trying to figure out what it will take for the bull market to reach a new record high. Records have been set in the Russell 2000, the tech sector, and the S&P 400, but the most followed index, which is the S&P 500, hasn’t broken its January 26th high. There have been several failed attempts at reaching that level.
One popular investing strategy which has prevailed during the duration of this bull market is trend following. This strategy works well when used alongside corporate and economic indicators, such as GDP growth, earnings and earnings expectations. Successfully trend following while being cognizant of changing economic signals would suggest to sell equities when the CAPE ratio is high (stocks are expensive) and falling or sell when the unemployment rate is low and rising. Stocks underperform when the CAPE is high and when the unemployment rate is low. Adding trend following to the mix helps with timing.
Investors who follow macroeconomics have a general sense that the economy is near the end of the cycle. Using the examples we’ve mentioned, the CAPE ratio is currently very high as you can see in @EconomPic’s chart below which means stocks are expensive.
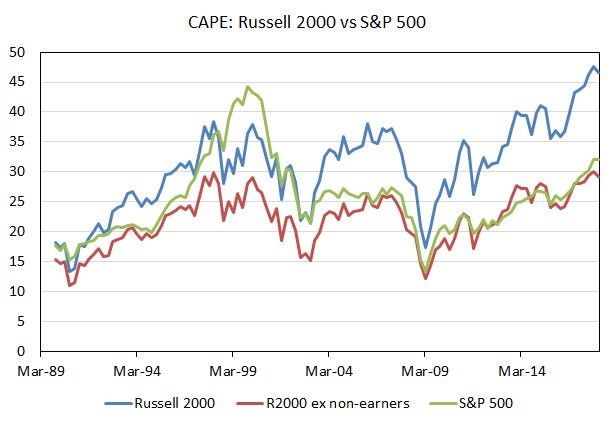
Source: Twitter @EconomPic
The chart adds in the fact that the Russell 2000 has a much higher CAPE ratio than the tech bubble peak. The numbers look better if you exclude the firms which don’t make profits, but it is also near a record. The unemployment rate is 3.8% which is the lowest since 2000. Stocks being expensive and the unemployment rate being low signal the economic cycle is almost over, and stocks have a lot of room to fall when they do.
Pennies In Front Of The Steamroller
Now you can get a clear picture of the anxiety long term investors are facing as the trend followers wonder if now is the time to sell. The economic growth rate is expected to be 3.9% in Q2, but that rate probably isn’t sustainable given the weakness in global growth and the potential tariffs which could be enacted. The only aspect stopping investors from selling is the trend which has been in place since 2009, the entirety of this bull market in equities. The longer the bull market stays below the all-time high and the quicker economic data weakens, the greater the risks rise of trend following turning in the opposite direction.
To be clear, the U.S. economy is standing alone in terms of economic performance as many advanced economies are seeing weakness along with China. The chart below from the Daily Shot shows America is the only major advanced economy which has seen its GDP estimates rise since the peak in January.
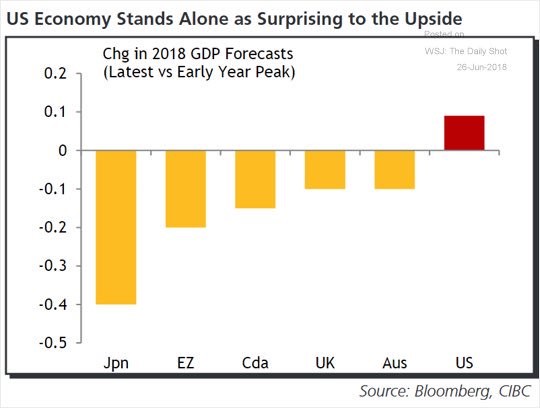
Source: Daily Shot
Investors who are worried about the end of this expansion think America has a better chance of following the other advanced economies and China lower than remaining above the fray. The temporary boost the tax cuts are bringing to capex could be cut short if heated trade rhetoric continues to increase uncertainty.
Yield Curve Flattening
The biggest signal investors are monitoring to assess the health of the economy is the yield curve, which is flattening and causing investors to be uncertain. To be clear, the indicator has signaled trouble after inversions, not where it’s at now. The Bloomberg chart below shows the 10 year yield minus the 2 year yield has fallen to 33 basis points.
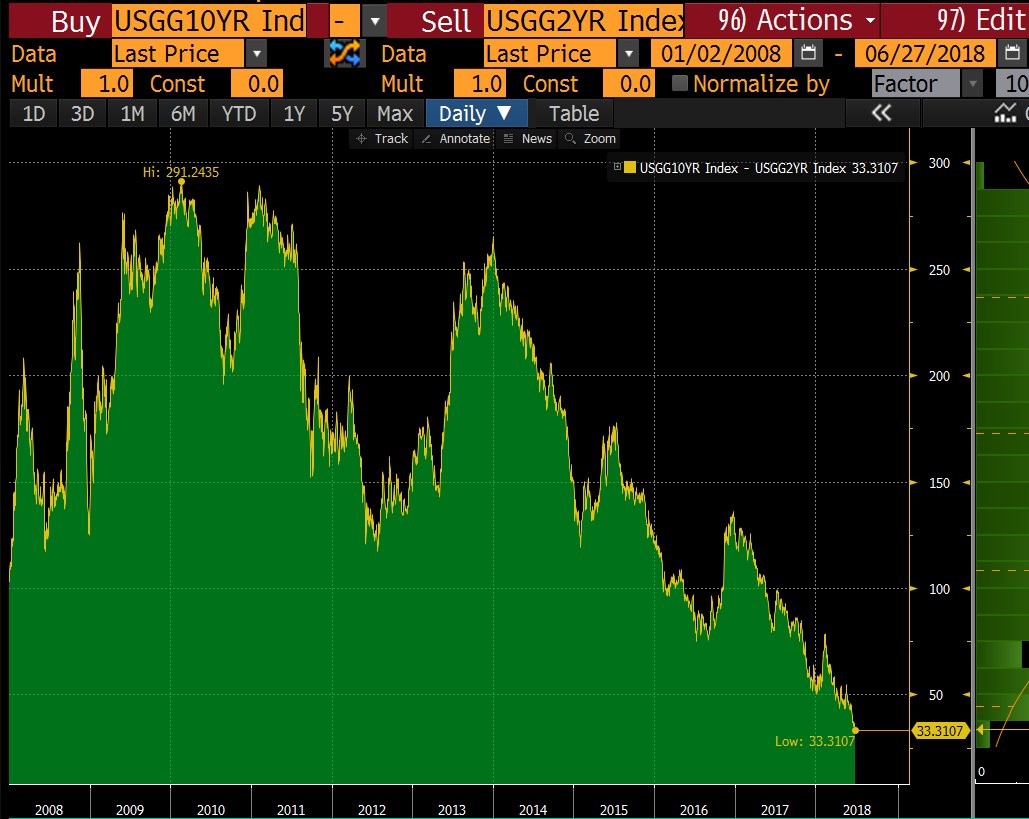
Source: Bloomberg
Ever since the Fed raised its expectation from 3 rate hikes in 2018 to 4 hikes the yield curve has flattened even faster. The other important aspect is the 10 year bond yield has fallen from its recent peak of 3.12%. Investors in the long bond aren’t buying into the idea that growth will accelerate further from this level. This is the most disconcerting aspect stock investors should glean from following the bond market.
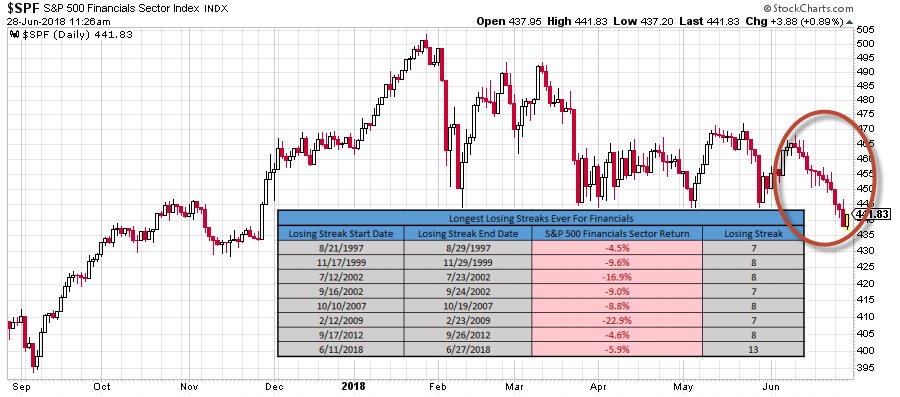
Why Are Financial Stocks Declining?
The one group of investors who are painfully aware of the current situation are those who own financial stocks. We’ve discussed a lot about how the heated trade rhetoric is preventing the S&P 500 from rallying to new highs. Another way of looking at this is to see which stocks are underperforming. As of June 27th, the XLF financial ETF is down 12.63% from its record high on January 26th. More interestingly, the ETF is down 13 straight days which is the longest streak recorded. That’s impressive given the financial crisis in 2008 saw the index fall more than 80%. The recent drop is not close to as severe, but it does suggest a warning signal that this economic cycle could be close to ending.
To be clear, banks borrow short dated bonds and sell long dated maturities, so when the difference between the two rates shrinks, their net interest margins are reduced. The bank stocks rallied after the 2016 election because Trump promised deregulation and rising rates helped net interest margins. With reform to Dodd-Frank, Trump has delivered some help to regional banks. However, now that it’s over, there isn’t a new catalyst to push them higher. With the recent decline in the 10 year bond yield, optimism is waning. Net interest margins in 2015 were 2.95%, which was the lowest ever recorded (records started in 1984). Net interest margins were 3.23% in Q1 2018. However, they could be headed down again since the curve is flattening.
Source: Twitter @RyanDetrick
Forward Market Returns Looking Grim
The financial sector has weighed heavily on the S&P 500 this year, but it won’t be the only sector facing pressure once the yield curve inverts. As you can see from Charlotte Lane’s chart below, the forward 5 year total returns are correlated with the yield curve.
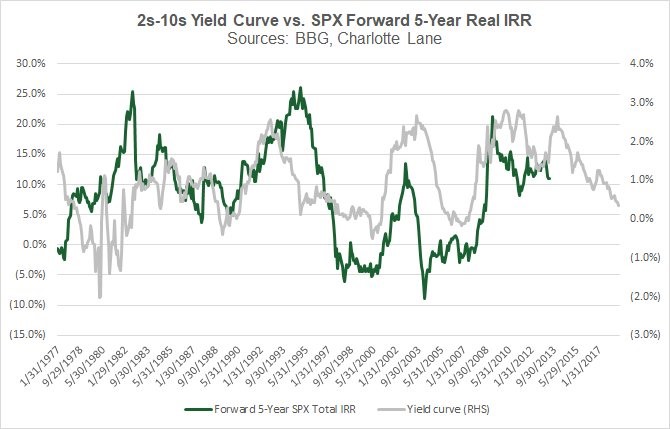
Source: Charlotte Lane
The current yield curve is indicating the next 5 years of returns could be in the low single digits per year or even negative.
Conclusion
This article aims to explain the recent action in stocks and show the anxiety equity investors are experiencing as the yield curve is 33 basis points away from an inversion. Another concern is the high CAPE ratio, which shows stocks are very expensive. Finally, the other concern is that GDP growth has peaked and will taper off, following the other advanced economies which have seen growth fall. Even though US GDP growth could be one of the strongest of this expansion in Q2, investors are not agreeing with markets seemingly flattlinging while certain sectors like financials experiencing record long declines. If the trade rhetoric ends and economic growth continues for a few more quarters, stocks might reach a new record high. However, investors should be cautious given the limited returns available given current valuations and forward real IRR. Unless there are renewed positive catalysts, there exists an elevated risk of a bear market in equities if trade tensions continue to elevate. Here is what happens during a typical bear market.
Have comments? Join the conversation on Twitter.
Disclaimer: The content on this site is for general informational and entertainment purposes only and should not be construed as financial advice. You agree that any decision you make will be based upon an independent investigation by a certified professional. Please read full disclaimer and privacy policy before reading any of our content.


