UPFINA's Mission: The pursuit of truth in finance and economics to form an unbiased view of current events in order to understand human action, its causes and effects. Read about us and our mission here.
Reading Time: 4 minutes
U.S. markets are in another speculative fervor. It’s possible that we are at beginning of the business cycle, but near the end of the speculative cycle because the Fed didn’t let markets fully crash in March. Investors don’t even fear a recession because all that happened this year was a quick crash and rebound. A recession wouldn’t end this speculation, not that we are near another one. The end will come when everyone is in the market and they realize the Fed can’t save their risky stocks with no sales.
It’s highly unlikely this fervor lasts several more years. It’s very common to see people on financial Twitter bragging about triple digit returns year to date. Obviously, there are always people who lie about returns, but in this case, 2020 was so great that they don’t need to lie. People really have made amazing gains.
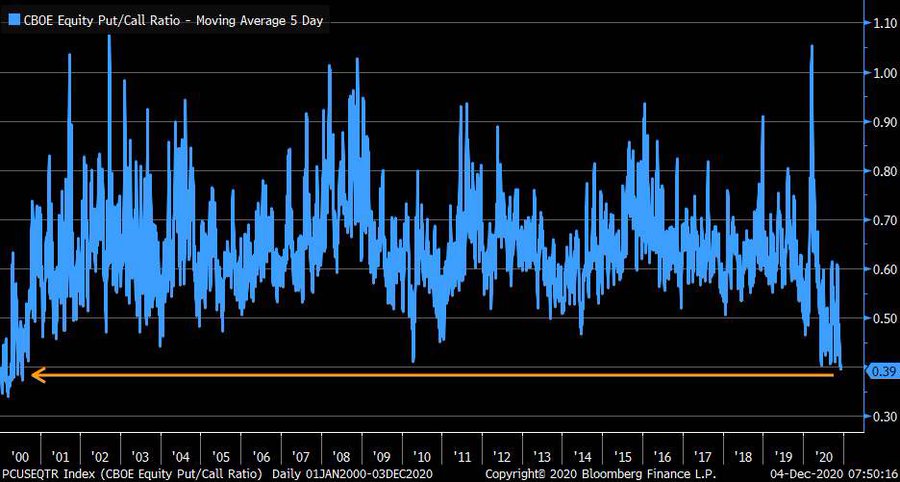
Let’s look at some of the euphoric data points. The NAAIM exposure index is at 103.17 which means for 3 weeks the average fund has been leveraged long. Short sellers simply don’t exist. The CNN fear and greed index is at 85 which signals extreme greed. As you can see from the chart below, the 5 day average of the CBOE put to call ratio is at a 20 year low. The junk bond yield is at 4.45% which is a record low. Over 90% of S&P 500 stocks are above their 200 day moving average which is the highest since 2011. The CAPE ratio is in the low 30s.
Value vs Growth
There has been a shift. Value stocks have beaten growth in the past few weeks. However, the highly predicted crash in growth stocks hasn’t come. The Nasdaq 100 is at a record high. The market wants its cake which is the rally in value stocks and doesn’t want to eat its vegetables which is a crash in the hottest stocks of the year which include software, electric vehicles, and online retail. These hot stocks shake off bad company specific news, high valuations, and good vaccine news which imply a return to normalcy. Value stocks are becoming less cheap, but growth stocks are still in a bubble.
As you can see from the chart below, the ratio of tech’s cumulative total return to energy recently peaked at a higher level than the tech bubble mainly because energy had its worst run since the early 1930s. We can’t just have energy stocks rally without money rotating out of the winners. We might see that happen in early 2021 as momentum stocks do the best in December and the worst in January.
Great Unemployment Claims Report?
Jobless claims fell sharply, but these great results were likely due to the Thanksgiving holiday. We must wait until next week to see if the labor market is really improving again. We might see a jump in claims next week. Last week’s initial claims reading was revised up from 778,000 to 787,000. In the week of November 28th, seasonally adjusted initial claims fell to 712,000 which was dramatically below estimates of 780,000 and the lowest estimate which was 755,000. It’s extremely rare for estimates to be this off. This was caused by Thanksgiving.
Unadjusted initial jobless claims fell from 836,000 to 714,000 which was a new cycle low. That was the biggest decline since the week of August 8th. PUAs fell 30,000 to 289,000. As you can see from the chart above, there was a 13% drop in unadjusted initial claims plus PUAs which was the biggest decline since late September. It ended the 2 week increase streak. It looked like claims were about to start an uptrend because of the third wave of COVID-19. There certainly hasn’t been a reversal of hospitalizations unfortunately.
Big Problem Coming
Seasonally adjusted continued claims fell from 6.089 million to 5.52 million. If this was an accurate depiction of the labor market, meaning no one was on pandemic benefits, the labor market would be a few weeks from doing well. However, there are millions of people on pandemic claims and the biggest reason for the decline in normal continued claims is people running out of benefits (6 months over). In fact, 13.4 million people are on the verge of losing their benefits if they aren’t extended before December 26th. McConnell is aiming for a $500 billion stimulus and the Dems support the bipartisan $908 billion stimulus.
The blue bars in the chart above show there are 14.9 million short term claimants; the red bars show there are 5.25 million long term claimants. The light red and light blue bars show the 13.4 million people who are on the verge of losing their benefits. It would be so easy for the government to extend these benefits for 2 months, but the two sides are still apart.
Another Decline In Job Cut Announcements
We got another decline in job cut announcements in November as the chart below shows. There were 64,797 job cuts announced in November which was up 45% from last year; this was the 2nd lowest reading of 2020. It was down from 80,666 in October.
There have been 2.228 million cuts this year which is a 298% increase from last year. In fact, there have been more job cuts in entertainment (857,620) in 2020 than all industries combined in 2019. There have been more cuts in California (397,783) and New York (260,209) combined in 2020 than the entire country in 2019. There were 185,504 hires in November which is higher than every other November since at least 2015. We expect a massive decline in job cut announcements in 2021.
Conclusion
Markets are in a state of abject euphoria. It’s like a trance where nothing is viewed as bearish. The ratio of tech returns versus energy peaked at a higher level than during the tech bubble. Jobless claims fell sharply, but this was the week of Thanksgiving, so take that improvement lightly. There was another sequential decline in job cut announcements. This was a terrible year that is ending on a less bad note. 2020 will probably hold the record for job cuts in a year for decades.
Have comments? Join the conversation on Twitter.
Disclaimer: The content on this site is for general informational and entertainment purposes only and should not be construed as financial advice. You agree that any decision you make will be based upon an independent investigation by a certified professional. Please read full disclaimer and privacy policy before reading any of our content.


