UPFINA's Mission: The pursuit of truth in finance and economics to form an unbiased view of current events in order to understand human action, its causes and effects. Read about us and our mission here.
Reading Time: 5 minutes
Before we get into the great retail sales report, we must review the solid real wage growth that drove spending growth. No matter what someone thinks of the trade war, they will likely spend more money if their real earnings increase. This is the difference between following what you read in the news and what your paycheck shows.
Very Solid Real Earnings Growth
Anyone fearful of the decline in nominal hourly earnings growth is ignoring the greater decline in inflation. Remember from our previous article, that headline CPI fell 14 basis points in June and nominal weekly earnings growth only fell 1 basis point. That was a clue the retail sales report would be strong. Despite a decline in headline GDP growth in Q2 from Q1, consumption growth will probably increase from the moribund 0.9% rate. Wells Fargo increased its estimate for Q2 PCE growth from 2.9% to 3.4% because of the retail sales report.
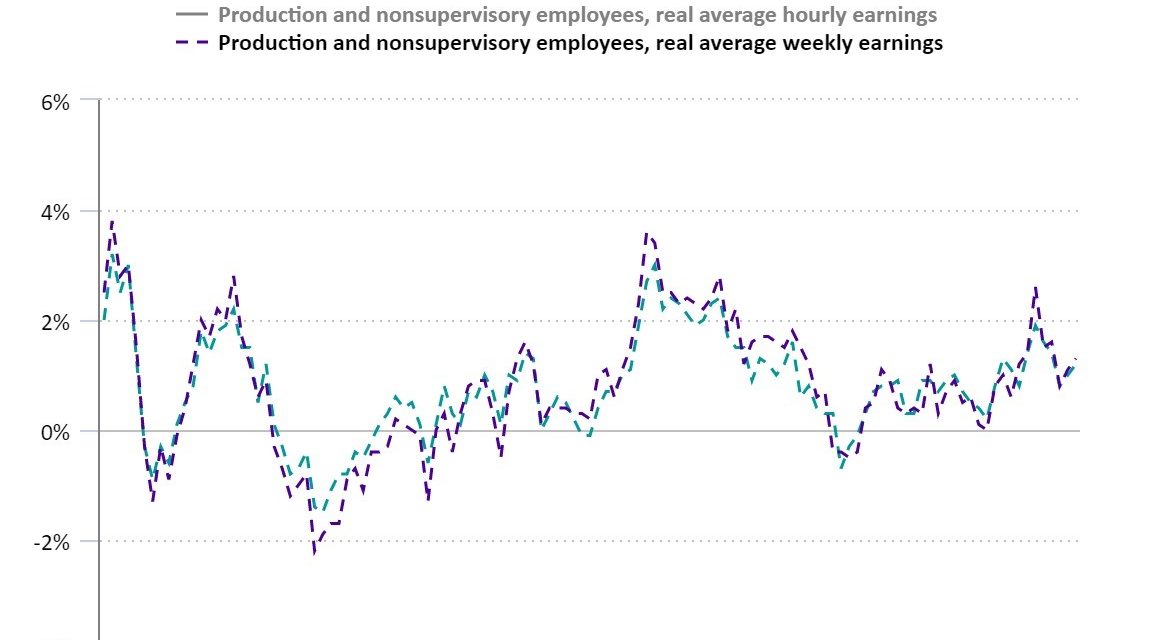
As you can see from the chart below, both average real weekly earnings growth and average real weekly earnings growth for production and non-supervisory workers increased.
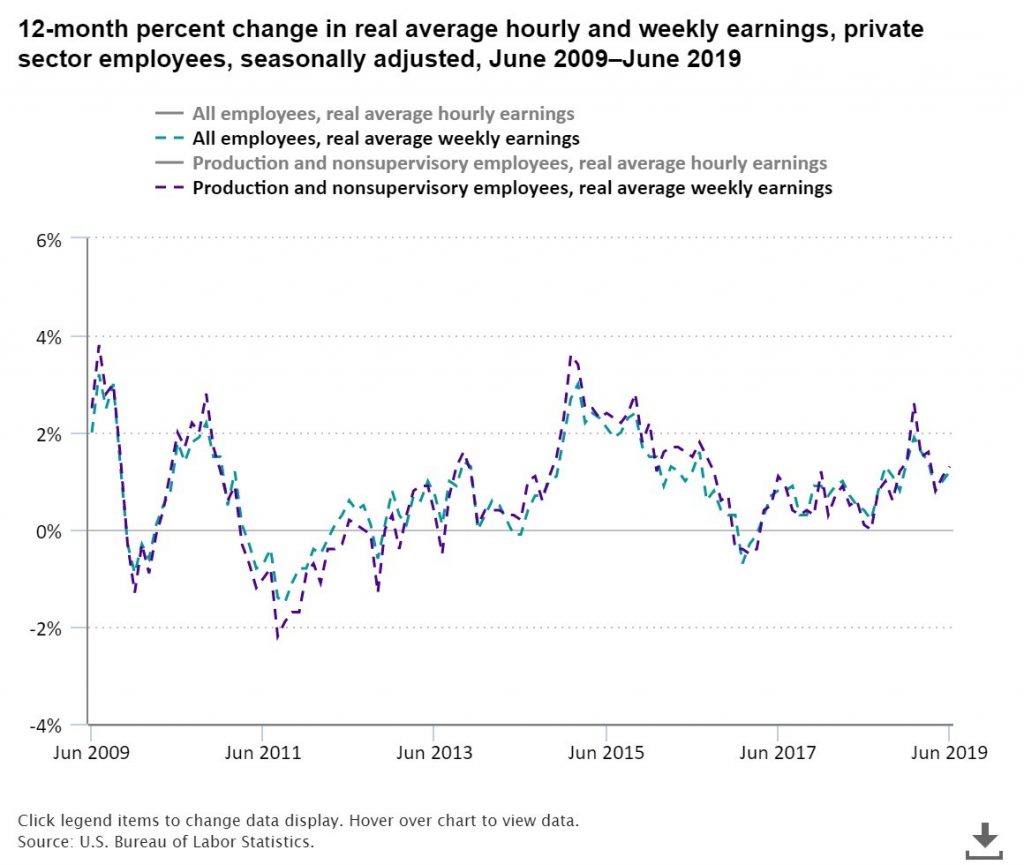
These readings and their hourly counterparts all saw 0.2% higher growth in June than May. Production and non-supervisory wage growth was 1.9% hourly and 1.3% weekly. It was higher than the overall average of 1.5% hourly and 1.2% weekly. Low skilled workers tend to see higher wage growth late in the cycle when the labor market is full. Keep in mind, the recent real wage growth is the most important of the cycle because the most people looking for work are seeing the gains as the unemployment rate is very low.
June Retail Sales Were Great
June retail sales growth beat estimates in every category and some of the details of this report were spectacular. 11 of 13 subcategories saw positive monthly sales growth. Headline monthly growth was 0.4% which beat estimates for 0.1%. Growth was 3.4% yearly which improved from 2.9% in May. Headline growth was actually one of the weakest categories because of the decline in gas prices. Sales at gas stations fell 2.76% monthly and 1.68% yearly. Retail sales less autos were up 0.4% monthly which doubled estimates. Monthly growth in motor vehicles and parts sales was 0.72% and yearly growth was 4.1%. Without autos and gas, growth was 0.7% monthly which beat estimates for 0.4%.
The chart below shows the most exciting part of this report, which also happens to be the most important category.
Retail sales in the control group were up 0.7% monthly which beat estimates for 0.4%. May’s reading was revised higher from 0.5% to 0.6%. Yearly growth was 4.6% which was the highest reading since October 2018. As you can see, the 5 year average is 3.8%. Even more impressive is the 3 month annualized sales growth was 7.5% in Q2 which is the highest reading since Q4 2005 when it was 8.4%. That’s a cycle high in yearly control group sales growth.
Online sales growth was 1.69% monthly and 13.42% yearly as its share of retail sales increased to 12.45%. Department store sales are only 2.18% of total retail sales. Food services growth was 0.92% monthly and 3.98% yearly. The consumer is readily shopping online and at restaurants which is a great sign for the economy. Control group spending was helped by the decline in gas prices which didn’t stop consumers from shopping online. The weakest categories were electronic stores and sporting goods stores which saw yearly declines of 4.97% and 3.3%.
Utilities Weigh On Industrial Production
This was a relatively weak non-recessionary June industrial production report. It wasn’t as great as the retail sales report, but it wasn’t as bad as some regional Fed surveys indicated. Production growth was 0% monthly which missed estimates for 0.1%. It was 1.3% yearly which was down from 2.1% in May. The report was weakened by utilities production growth which was -3.6% monthly and -2.6% yearly. That category is impacted by the weather. Monthly mining growth was 0.2% and yearly growth was 8.7%.
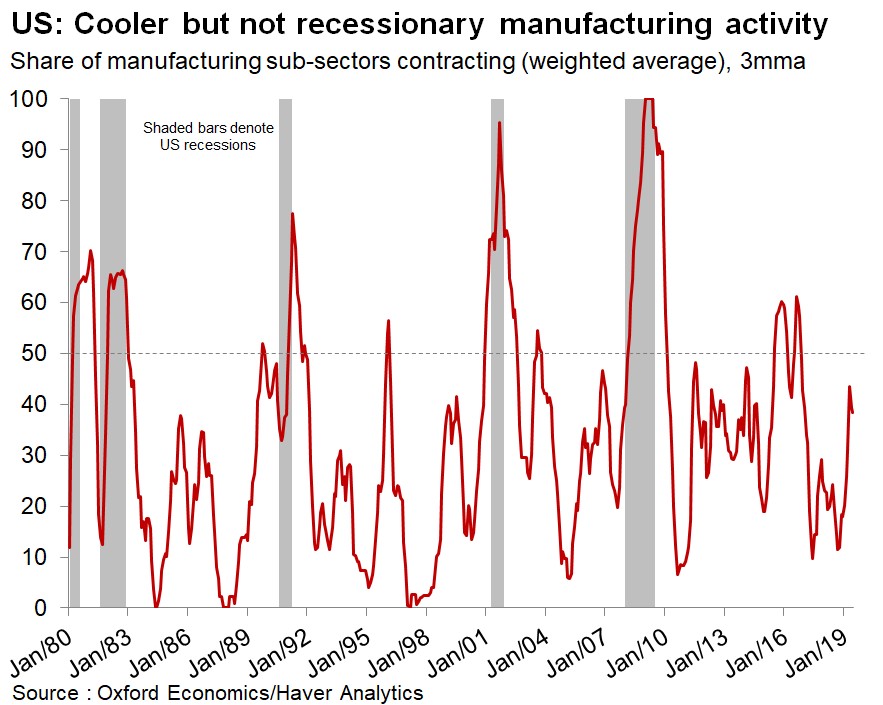
The most important category in this report is manufacturing production. It was great on a monthly basis, but weak on a yearly basis. Monthly growth was 0.4% and yearly growth was 0.5%. That doubled monthly estimates. Yearly growth fell from 0.8%. As you can see from the chart below, the 3 month weighted average of the percentage of manufacturing sub-sectors that are in a recession fell modestly.
The capacity to utilization rate fell from 78.1% to 77.9% which missed estimates for 78.2%. There’s plenty of room for production to increase if demand picks up.
The End Of The Business Cycle?
As you can see from the chart below, the Bank of America survey shows the net percentage of fund managers who think business cycle risk is above normal is the highest since the 2011-2012 slowdown. It is about 70%.
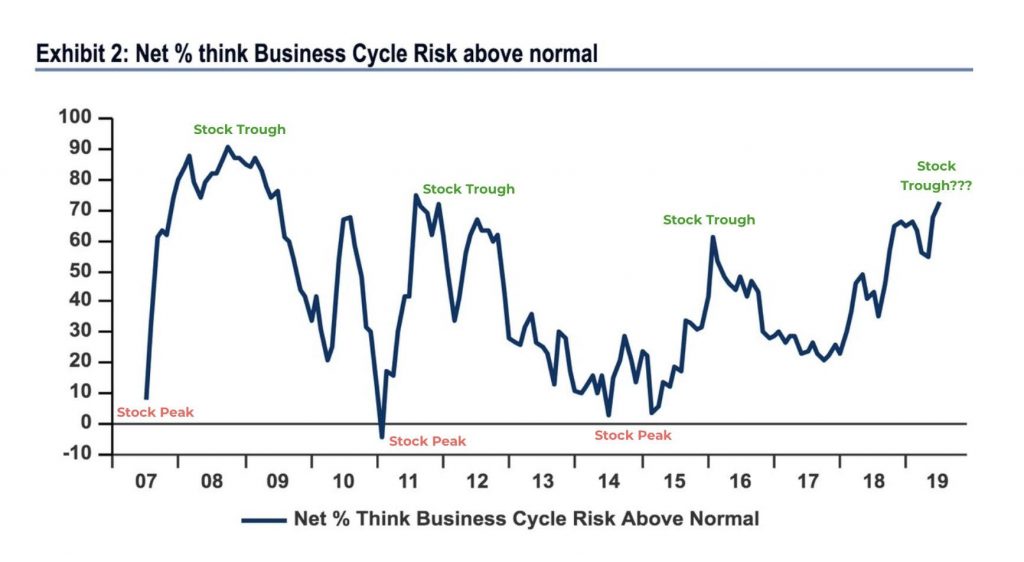
Fund managers are bearish or at least cautious because they think the cycle is on its last legs. As the annotations show, fund managers were bearish at troughs and bullish at peaks. The confusing element is stocks are already near their record high as the increase in this percentage didn’t coincide with a decline in stocks.
Arouba-Diebold-Scotti Index Shows No Sign Of A Recession
The chart below shows a less common American business conditions index created by the Philly Fed.
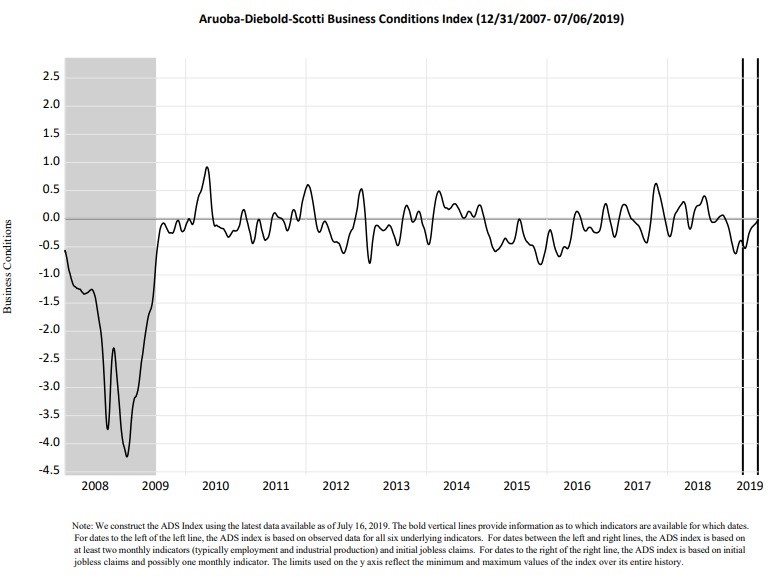
The Aruoba-Diebold-Scotti business conditions index uses weekly initial jobless claims, monthly payroll employment, industrial production, personal income less transfer payments, manufacturing and trade sales, and quarterly real GDP to create an index that tracks real business conditions. When the index is above zero there are better than average conditions, like there are now. Below zero is worse than average conditions. Keep in mind, not all the data is out in between the 2 vertical lines, so the complete data index is still negative. The index never fell below 2 during the 2001 recession and the 1990-1991 recession. You can see how it did during the last recession. It’s nowhere near signaling a recession now.
Conclusion
Retail sales growth was very strong especially when you remove the negative impact of gas prices. This signals the consumer is strong which makes sense because real wage growth improved in June. Personal consumption growth will be much higher in Q2 than it was in Q1. Industrial production growth wasn’t great as it was hurt by utilities production. Manufacturing growth was weak, but not recessionary. Fund managers are worried about the end of the cycle. That’s a bullish sign for stocks. The Aruoba-Diebold-Scotti business conditions index signals the U.S. economy isn’t close to a recession.
Have comments? Join the conversation on Twitter.
Disclaimer: The content on this site is for general informational and entertainment purposes only and should not be construed as financial advice. You agree that any decision you make will be based upon an independent investigation by a certified professional. Please read full disclaimer and privacy policy before reading any of our content.


