UPFINA's Mission: The pursuit of truth in finance and economics to form an unbiased view of current events in order to understand human action, its causes and effects. Read about us and our mission here.
Reading Time: 3 minutes
Some say it’s a bad time to live in big cities, but we can flip that around and say there hasn’t been such an affordable time to live in big cities in years. Furthermore, now that vaccines have been going out quickly (besides in the northeast which dealt with a big snowstorm) cities will soon be a desirable place to live again. It will work out great for renters who signed lease agreements at low prices. They will be paying low rent for a few months after the cities open up.
As you can see from the chart below, the 10 largest yearly declines in rents are from 12% to 27%. There has been a large social media campaign of people leaving San Francisco for Miami and Austin. That might be a separate issue outside of the pandemic. Business leaders don’t like how the government is run in these areas.
Office space is in a similar situation as residential rentals. Office availability rose 14.9% in January which is the highest since at least 2000. This is near the peak impact from the pandemic as workers will start returning to offices within the next few months. Leasing fell by almost 47% from last year. Rent prices fell for the 7th month in a row to $73.65 per square foot. Leasing supply in Manhattan was 1.9 million square feet in January which is the highest since July and 20% above the average last year.
Consumer Spending In January
As we mentioned in a previous article, January retail sales will be strong because of the stimulus. Redbook same store sales growth in the week of January 30th rose from 3.9% to 4.4%. The charts below show the latest spending according to Chase card data. Aggregate card spending growth improved in January, but it’s still negative. Discretionary spending is underperforming as spending on entertainment is suppressed. The worst hit groups have been airlines and lodging.
Amazon had a great holiday quarter which isn’t a surprise. They had $125.56 billion in sales, surpassing the $100 billion mark for the first time. It guided for 33% to 40% sales growth in Q1. The tough comps start in Q2. The company now has 1.3 million employees which is a 63% increase from last year. It’s the 2nd largest employer in the world. It’s move to automation will have a massive impact on the economy.
Are Stocks Expensive Or Not?
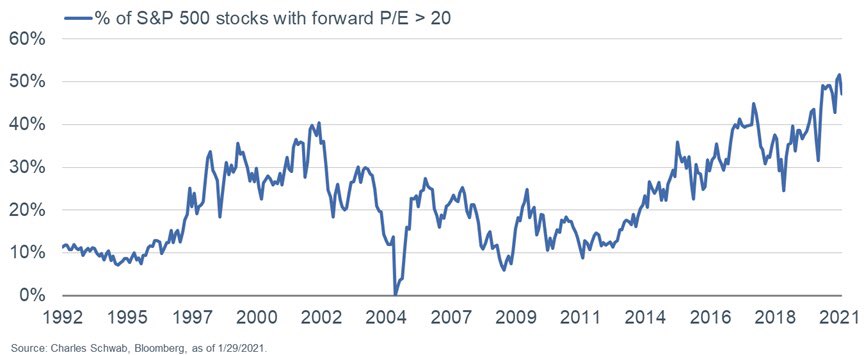
In late January, the stock market had a mini correction because funds de-grossed after having the highest gross exposure in 10 years. It was related to the short squeezes in a few highly shorted names. Many investors focused on valuations were looking for a correction in Q1 2021. However, we got the exact opposite. Valuation hawks have a good point. As you can see from the chart below, the percentage of the S&P 500 stocks with a forward PE ratio of more than 20 is at a record high. Keep in mind, forward earnings estimates have fully come up. This isn’t 8 months ago when estimates were way too low. Forward estimates are as accurate as they ever will be/have been. The market is downright expensive.
We found a new argument the bulls are using to justify high valuations. As you can see from the table below, the stocks with the highest ROIC, ROE, and sales growth have the highest valuations. However, we think this is a strawman argument because no one is arguing the market is valuing individual stocks versus each other incorrectly.
The bearish case is the overall market is expensive. Furthermore, plenty of high growth non-profitable companies not in the S&P 500 are too expensive. Finally, it’s worth noting during the tech bust in the early 2000s, stocks fell before the business fundamentals cratered (reflexivity). Extreme valuations of more than 20 times sales can’t be sustained. If something can’t be sustained, don’t be surprised when it ends.
Crazy Correction: Something Broke
As we mentioned, there was a mini-correction in late January which some might not have caught because it was pretty small. The S&P 500 only fell 3.57%. However, it was a bigger deal for the profitable small caps as the unprofitable firms rallied higher because of short covering. Something broke badly in the market just like during the short VIX implosion in early 2018. As you can see from the chart below, the S&P 600’s 1 month index dispersion was over 200% which is over double the dispersion at any point in the past 14 years.
Conclusion
Rents are down huge which makes living in cities more affordable. Life will be great for big city dwellers who locked in low rent once the pandemic is better contained within the next few months. Office space is overflowing. That should change as people go back to work. There was a bump in consumer spending in January. The highest percentage of the market has above a 20 PE multiple ever. Sure, better companies have higher multiples, but that doesn’t mean the market isn’t overvalued.
Have comments? Join the conversation on Twitter.
Disclaimer: The content on this site is for general informational and entertainment purposes only and should not be construed as financial advice. You agree that any decision you make will be based upon an independent investigation by a certified professional. Please read full disclaimer and privacy policy before reading any of our content.


