UPFINA's Mission: The pursuit of truth in finance and economics to form an unbiased view of current events in order to understand human action, its causes and effects. Read about us and our mission here.
Reading Time: 4 minutes
Healthcare is the 2nd biggest sector in the S&P 500 (14%), so it drives the market’s performance to a certain extent. It could be affected by the 2020 election as all the Democratic presidential candidates want to overhaul the system somehow. The left wing candidates are in favor of Medicare for All, which is widely considered to be bad for health insurance companies. Left wing candidates want to potentially eliminate private insurance.
Warren is the most viable left wing candidate according to the betting market. Elizabeth Warren has a national polling average of 20.6% and Bernie Sanders (the other top left wing candidate) is at 16.6%. However, Warren has a 34% chance of winning and Sanders is only at 14% according to the betting odds on PredictIt. This likely is related to electability and how the market sees the election playing out.
The moderate lane is mostly controlled by Vice President Biden and Pete Buttigieg. This concept of there being two lanes (left & moderate) explains why Pete can have an average of 7.1% in the polls, yet have a 18% chance of winning. To be clear, Biden leads the polls with 29.1% and has a 23% chance of winning.

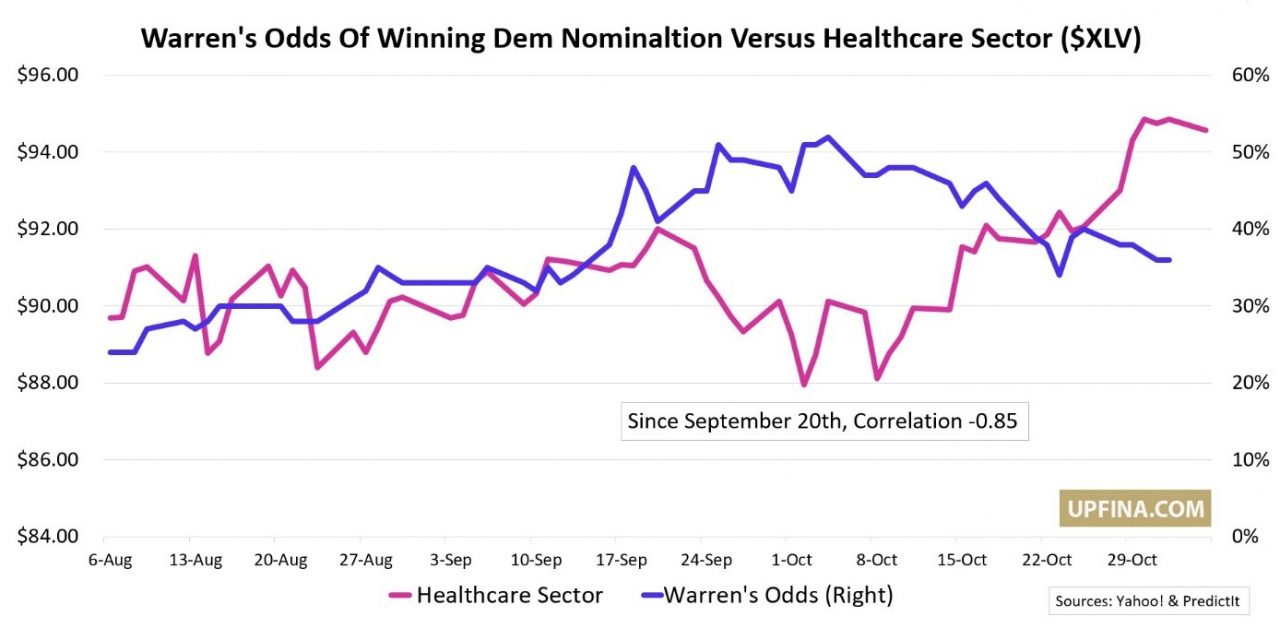
We plotted the performance of the healthcare sector and Warren’s PredictIt election odds in the chart above. There wasn’t much of a relationship between the two in August and early September possibly because neither moved much. As the chart above shows, since September 20th, there is a strong negative correlation of -0.85 between the two. This makes sense because Warren’s Medicare for All plan would hurt insurance companies’ profits.
Some might be skeptical of looking at the election odds when the first Democratic votes take place on February 3rd. It’s not too early. Whenever the market prices in a victor, it will be too late to make any trades based off it unless the situation changes. It’s clear, the market doesn’t have a grasp of who will win the Democratic party nomination. We only know that there is a high chance it will be one of the four candidates we mentioned.
Strong Holiday Season Likely
There is low inflation, a low unemployment rate, positive real wage growth, cheap gas, and less uncertainty surrounding trade. These are all great signs for the consumer. Last year, stocks were plummeting and there was a government shutdown. We obviously don’t know where stocks will go, but they have had a great year. There definitely won’t be a government shutdown like last year. As we mentioned, the consumer’s savings rate even increased 0.2% to 8.3% in September which is the highest rate since March. That money could be spent this holiday shopping season. Last September, the rate was 7.5% which isn’t low, but is lower.
Interestingly, even though only about half of the Q4 volatility in stocks had occurred in October and the government shutdown hadn’t started and wasn’t a huge story, the Gallup poll below shows consumers were already considering spending less on Christmas in October of last year.
As you can see from the chart above, in October 2018, consumers said they would spend $885 on Christmas. That was down 2.3% from the prior year. This October, the consumer looks very willing to spend. Now they are planning to spend $942 on Christmas which is a 6.4% increase from last year. Furthermore, 37% of respondents plan to spend over $1,000 which is up from 33% last year. Expected spending is the highest since at least 2002.
Q3 Earnings Season Turnaround
Q3 earnings season has been great because of its impact on Q4 EPS estimates. The situation changed for the better on October 11th after results were getting off to a rough start. As you can see from the table below, before October 11th, Q4 EPS estimates were lowered by 3.98% after firms reported. 9% of estimates were raised and 87% were lowered. As of this past Friday, after October 11th, Q4 EPS estimates were only lowered by 0.59%. 23% of estimates were raised and 57% were lowered. That’s a huge turnaround. It explains why the S&P 500 rallied 6.4% from October 8th to November 4th.
Let’s quickly look at the latest results as of Monday. With 371 S&P 500 firms reporting earnings, 60% beat sales estimates with 3.91% growth. 75% beat EPS estimates as non-GAAP EPS growth was 2.74%. GAAP earnings growth was -4.81%, GAAP EPS growth was -0.44%, and non-GAAP earnings growth was -2.21%.
Weak October Motor Vehicle Sales
As you can see in the chart below, there were 16.5 million total vehicles sold in October which missed estimates for 17 million and the low end of the consensus range of 16.8 million.
The September reading was revised down 0.1 to 17.1 million. Vehicle sales have average 16.9 million this year, so it was below that. The prior 2 years averaged 17.2 million and 17.1 million, so this has been a modestly weaker year. This poor October report implies motor vehicle and parts sales will be weak in the October retail sales report. Finally, domestic vehicle sales were 12.7 million which was down from 13.4 million.
Owners Living In Houses Longer
Homeowners are living in their houses longer. Homeowners live in their houses 13 years which is 5 years more than they did in 2010. As you can see from the chart below, this is causing a decline in homes for sale per 1,000 people.
There is less inventory of houses to buy especially with the weak housing starts this cycle. The top 3 cities in terms of median years lived in houses are Salt Lake City, Houston, and Fort Worth. They all are in the low 20s.
Conclusion
Currently, Warren has the best chance of winning the Democratic nomination. If she or Sanders gain in the betting odds, healthcare stocks could drop given their strong negative correlation. Consumers expect to spend 6.4% more on Christmas than they did last year. It should be a strong holiday shopping season. Ever since October 11th, Q4 earnings estimates have been barely declining after earnings reports. The October motor vehicle sales report was weak. People are living in their homes longer which suppresses the inventory of houses for sales.
Have comments? Join the conversation on Twitter.
Disclaimer: The content on this site is for general informational and entertainment purposes only and should not be construed as financial advice. You agree that any decision you make will be based upon an independent investigation by a certified professional. Please read full disclaimer and privacy policy before reading any of our content.


