UPFINA's Mission: The pursuit of truth in finance and economics to form an unbiased view of current events in order to understand human action, its causes and effects. Read about us and our mission here.
Reading Time: 4 minutes
The cycle high new home sales reading in June, the solid MBA purchase applications growth (15% growth in the week of September 13th), and the strong improvement in current sales in the September housing market index were all confirmed by the strong August housing starts report. Most of the data is headed in the right direction and this is even before the yearly comps get much easier in Q4. The decline in mortgage rates is doing wonders for demand. The excess inventory was worked through. Many blamed this cycle’s low housing starts on supply, but it has always been a demand issue. Housing became unaffordable last year, so demand weakened. If the labor market stays strong, demographics should take hold of housing and drive it higher. A large number of millennials are entering their early 30s which is when people buy their first home.
Finally, An Improvement In Real Residential Investment Growth
The housing market is critical for the economy because before the housing starts report was released, the Atlanta Fed GDP Nowcast only forecasted 1.9% Q3 GDP growth. Real residential investment growth has hurt GDP for 6 straight quarters. As you can see from the chart below, the increase in housing starts in August to the highest level since June 2007 might be enough to push real residential investment growth above 0%.
At least it won’t be a huge drag on growth. The yield curve inversion wasn’t a negative because long bond yields fell which helped the housing market. Some say the weakness in housing earlier this year was enough to signal a recession. The potential improvement in housing in 2H 2019 because of the decline in rates will counter that indicator.
The housing reports that have beat estimates this week, including the existing home sales report which we will review next, have helped drive the economic surprise index from less than -60 in July to 41.3. Economists lowered their estimates enough for reports to beat them. This could be an early indication that the slowdown is ending.
Great Existing Home Sales
The August existing home sales report added to the plethora of solid housing market reports. Existing home sales improved 1.3% to 5.49 million which beat estimates for 5.38 million. The yearly growth rate improved from 0.6% to 2.6%. This was the strongest report since early last year. As you can see from the charts below, the improvement in existing home sales was catalyzed by the decline in the average 30 year fixed rate.
The median existing home price was $278,200 which was down from July, but up 4.7% from last year. That’s higher than the growth shown in the July Case Shiller index, but lower than the growth seen in the FHFA index. Those home price reports come out next Tuesday and the new home sales report comes out on Wednesday. Getting back to the existing home sales report, supply fell to 1.86 million units; inventories fell from 4.2 months to 4.1 months of supply. The South had the highest yearly growth. Next were the Midwest, West, and Northeast. The Northeast had the highest monthly gains similar to its great improvement in the September Housing Market index.
Leading Economic Indicators Flat
The July leading indicators index was revised to show 0.4% monthly growth instead of 0.5%. The August report was exactly the same as July as the index stayed at 112.1. Monthly growth of 0% met estimates. Stocks rebounded from their correction low, but still hurt the index a bit. The positive contributions were from permits, the Leading Credit Index, and manufacturing hours worked. The index was hurt by the manufacturing components and the yield curve. Essentially, the treasury market helped and hurt the index since low rates helped permits. The index is up 0.5% in the past 6 months which is a 1.1% annual rate. The coincident index rose 0.7% in the past six months which is about a 1.9% annual rate.
As you can see from the chart above, the ratio between the leading index and the coincident index has been flattening, but hasn’t declined. This makes this period look like the prior two slowdowns rather than the period prior to the last recession. If this slowdown lasts around as long as the past two this cycle, it is about halfway done. Since the leading index is at a record high, it’s not giving off a recession signal. In the past three cycles, it peaked 17 months, 10 months, and 20 months before recessions.
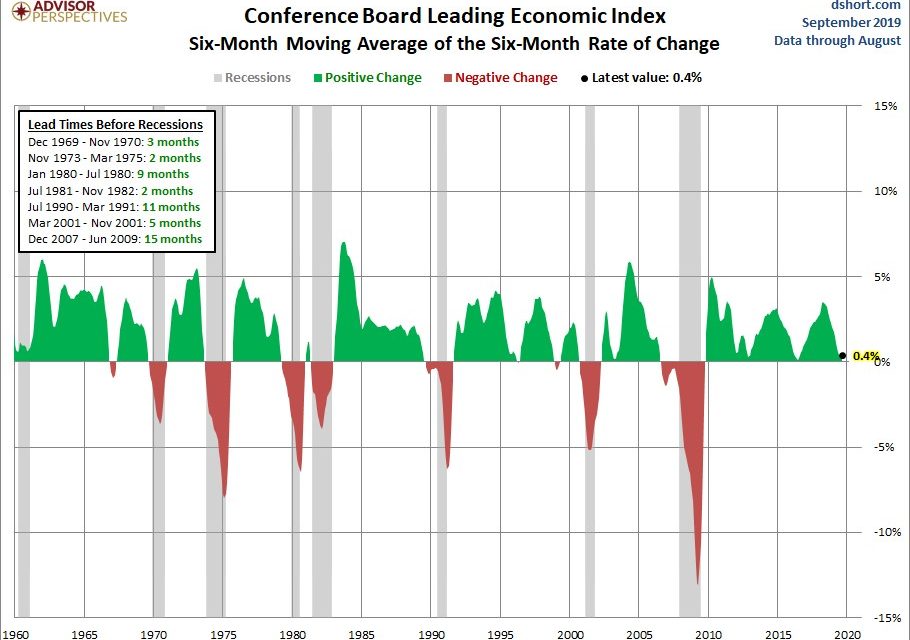
As you can see from the chart below, the 6 month moving average of the 6 month rate of change is just above giving off a recession signal. It’s at 0.4% growth.
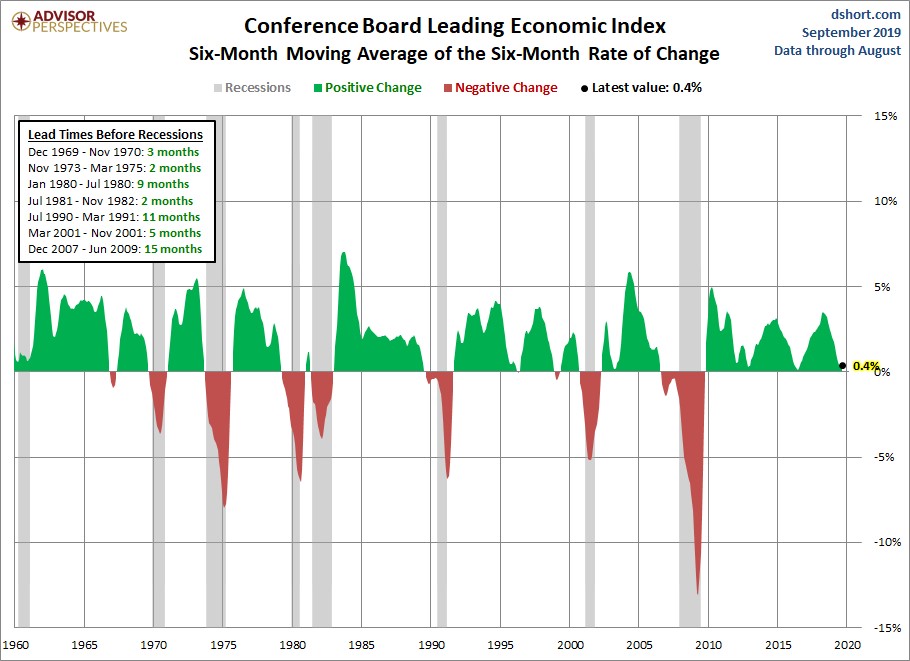
Anything below 0% is a recession signal. Since the weakness is recent, the 1 year moving average of the 1 year rate of change shows 3.2% growth which is above the troughs in the past 2 slowdowns which were between 1% and 2%. Jobless claims and stocks should help the index in September. The 4 week average of jobless claims in the week of September 14th fell 1,000 to 212,250.
Does A Recession Even Matter?
We think some investors obsess about recessions because a bad one means stocks will fall sharply. Humans long for certainty. A bad recession gives them this. Obviously, the media discusses recessions because negativity sells and job losses effect people more than 20% declines in stocks do. The chart below shows about 45% of bear markets since 1900 had no relationship with a recession.
The 20% decline late last year had no relationship with a recession as there hasn’t been one in 2019. You don’t need to call for a recession to call for a bear market. Expansions don’t guarantee great stock performance.
Conclusion
The decline in rates might allow housing to finally help GDP. The trend of housing reports beating estimates continued with the solid August existing home sales report. The leading index signals there is no recession coming soon. However, the 6 month moving average of the 6 month rate of change is precarious. Stocks don’t need a recession to fall into a bear market.
Have comments? Join the conversation on Twitter.
Disclaimer: The content on this site is for general informational and entertainment purposes only and should not be construed as financial advice. You agree that any decision you make will be based upon an independent investigation by a certified professional. Please read full disclaimer and privacy policy before reading any of our content.


