UPFINA's Mission: The pursuit of truth in finance and economics to form an unbiased view of current events in order to understand human action, its causes and effects. Read about us and our mission here.
Reading Time: 5 minutes
The ADP report was completely inaccurate as it showed only 67,000 private sector jobs were created. 254,000 private sector jobs were added in November which beat estimates for 168,000 and the high end of the estimate range which was 200,000. The Markit report which called for 100,000 jobs added also was wrong. The recent positive employment reading in the ISM report, the strong jobless claims reports, and the lower job cut announcements had this right. The most pivotal aspect of this November BLS report is that it’s another signal that the trend is changing.
With 12,000 government jobs added, there were 266,000 jobs created which was the most since January. That beat the consensus of 180,000 and the high end of the estimate range which was 210,000. The tide in job creation growth is turning just like it did in late 2017 which is great news for consumers. As you can see from the chart below, the 3 month average of job creation increased to 205,000 which is the highest since January.
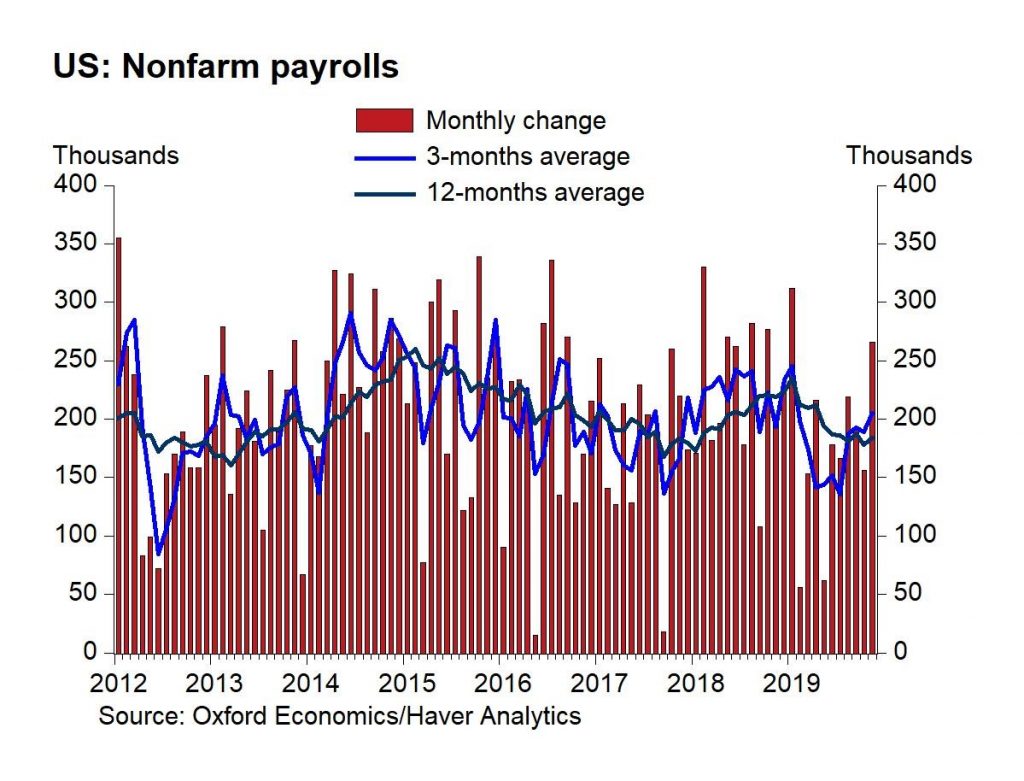
The 1 year average is bottoming as it increased to 184,000. This report was great because it beat estimates and previous reports were revised higher. The October reading was revised up from 128,000 to 156,000 and the September report was revised up 13,000 to 193,000.
Education & Health Services
Manufacturing job creation was 54,000, but this strength came from the end of the GM strike which added 41,000 jobs. Even without this one time event, job creation beat estimates. As usual education and health services led the way as it added 74,000 jobs. This report is being criticized for this because this industry is acyclical. On the one hand, this is accurate as this industry takes share as a percentage of the labor market in recessions.
However, as education and healthcare grows as a percentage of the labor market, the labor market becomes less cyclical. It had a massive increase as a percentage of the labor market in the 2008 recession. In January 2000, it was 11.5% of the labor market and now it’s 16.1%. It increased about 1.3% in the last recession and 0.4% in the 2000 recession. This isn’t a new trend. It was just 3.9% of the labor market in June 1943. The job losses in the next recession will be mitigated by this industry’s growth in the last recession. The 2nd key point is this industry pays very close to the national average. It pays $27.81 an hour and the private sector average is $28.29. This criticism doesn’t hold merit like the criticism of leisure and hospitality jobs which only pay $16.77 an hour which is the lowest out of any industry. It added 45,000 jobs in November.
Even though the ADP report showed professional and business services created 28,000 jobs, it actually created 38,000 jobs. This industry is followed closely because it is cyclical and pays workers well. Their average hourly wage is $34.16. The chart below shows the share of job growth by industry and in the past year. Our point about education and healthcare being able to carry the water in a recession is already holding true now in this modest slowdown.
Business investment growth was negative in Q3 and might be so in Q4. Yearly growth in professional and business job creation fell from 2.9% in April to 2.1% in November (rate didn’t change this past month), yet we’ve seen a rebound in overall job creation. Although it doesn’t seem like a big deal, the 13,000 jobs added in information services is important because it is the joint high (with June 2019) since June 2016. These jobs pay an average of $42.29 which is the highest out of all industries.
Fuller Labor Market Than 1999
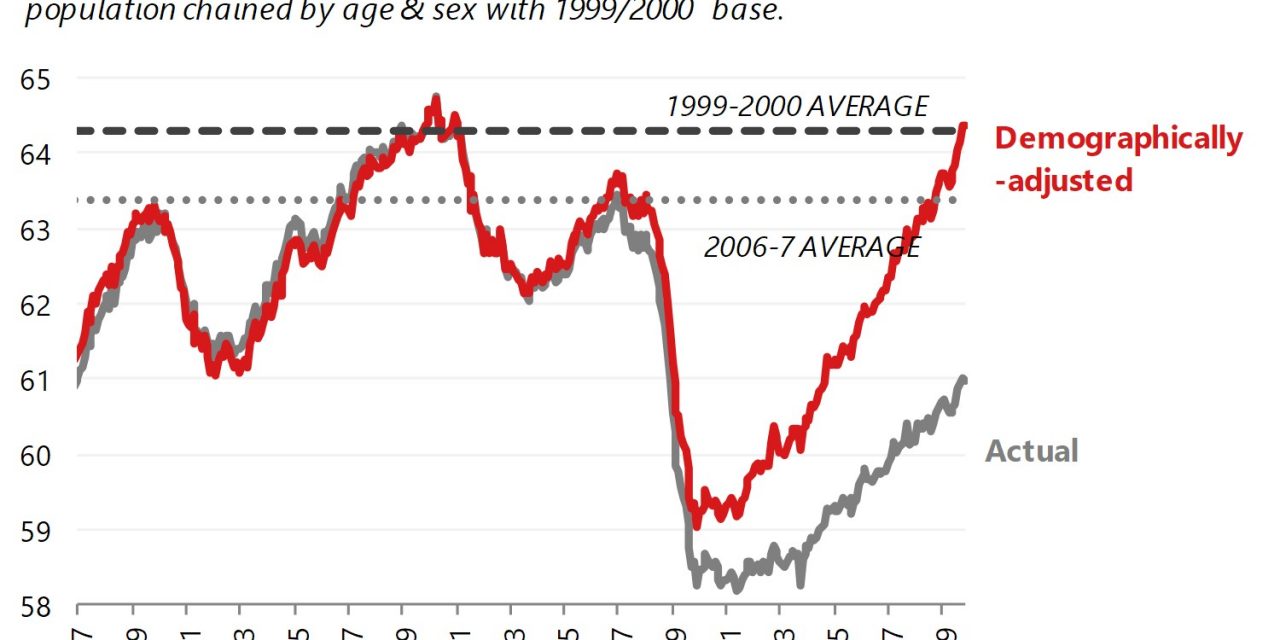
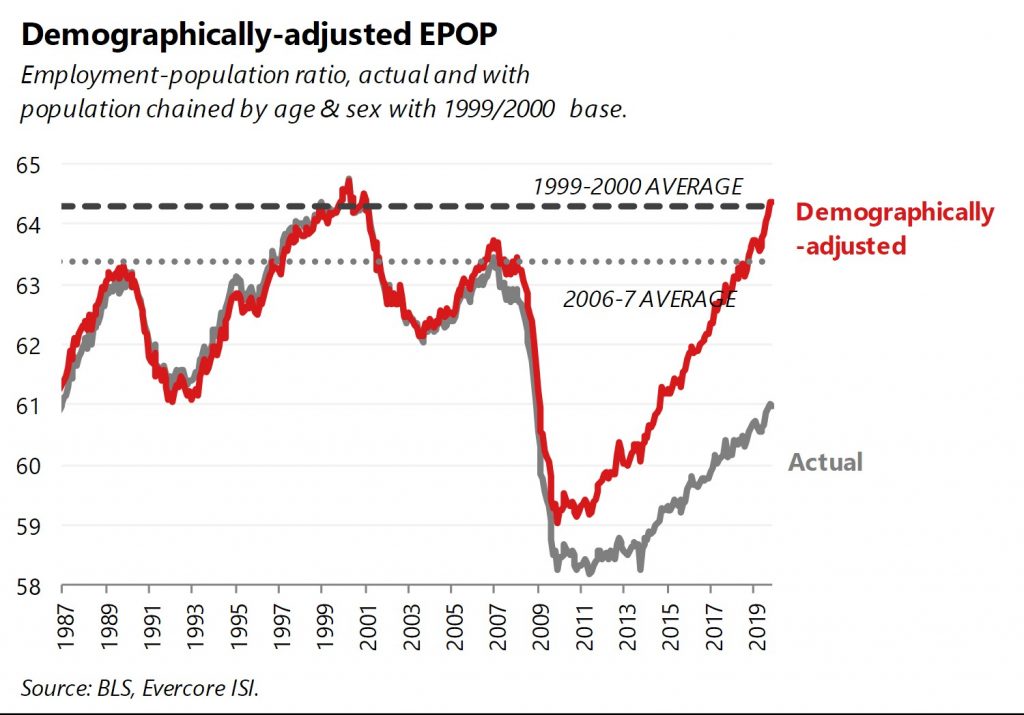
The unemployment rate fell 0.1% to 3.5% which puts at joint low (with September) since December 1969. The underemployment rate fell 0.1% which puts it at a joint low (with September) since December 2000. The lowest reading ever was 6.8%. The labor force participation rate fell 0.1% to 63.2%. Even so, the prime age labor force participation rate stayed at 82.8%. As you can see from the chart below, the demographically adjusted employment to population ratio widened its lead over the 1999-2000 average. Even though this signals the labor market is full, job creation is over double the amount needed to keep up with population growth.
Where Are Workers Coming From?
The next obvious question is where all these workers are coming from if the labor market is full. The answer is they are coming from outside of the labor market as you can see from the chart below.
If you aren’t looking for a job, you don’t count as unemployed. However, if there are job training programs and high wages because of the tight labor market, people will jump back into the labor force. The number of people who are unemployed and not in the labor force, but want a job as a percentage of the population is at a record low. The percentage is also at a record low if you add in people working part time for economic reasons.
Strong Real Wage Growth
In October, average hourly wage growth was revised from 3% to 3.2%. In November it fell to 3.1% which beat estimates for 3%. With a 35 basis point tougher comp, this 5 basis point decline had a 0.3% higher 2 year growth stack. As you can see from the chart below, wage growth is being dominated by the 80% of the labor force considered production and non-supervisory.
There has been a major divergence in favor of everyday workers. Production and non-supervisory wage growth fell 10 basis points to 3.65%, but the October reading was a cycle high and the comp got tougher by 23 basis points. The work week length stayed at 34.4 hours, but weekly earnings growth improved from 2.9% to 3.1% which is the highest rate since March.
Remember, inflation has been falling, so real wage growth is still very strong. The chart below shows the 5 year CAGR of real wage growth for production and non-supervisory workers. Current nominal growth is in the 78th percentile since 1986 and real growth is in the 89th percentile.
Conclusion
November job creation was really great considering how tight the labor market is. It pushed up the 3 month and 1 year average growth rates which many probably didn’t think was possible. The very strong real wage growth should help consumers this holiday shopping season. It’s amazing to see such high real wage growth with a full labor market. It means a large swath of people are seeing the gains.
Have comments? Join the conversation on Twitter.
Disclaimer: The content on this site is for general informational and entertainment purposes only and should not be construed as financial advice. You agree that any decision you make will be based upon an independent investigation by a certified professional. Please read full disclaimer and privacy policy before reading any of our content.


