UPFINA's Mission: The pursuit of truth in finance and economics to form an unbiased view of current events in order to understand human action, its causes and effects. Read about us and our mission here.
Reading Time: 5 minutes
We did a survey on Twitter where we asked our followers if stocks are still in a bear market. Out of 122 responses, 70% said this is still a bear market and 30% said this is a bull market. People’s definition differs. Some say a 20% rally makes a bull market and some say the market needs to reach fresh highs for there to be a bull market. Even though this should probably be a definitional question, there’s a certain amount of opinion that seeps in. We know this because when stocks are down a few percentage points from their record high, it’s common to hear the most negative traders say we are already in a bear market because they say it is just the start of the decline.
We don’t need to extrapolate sentiment from our poll though. The AAII investor sentiment survey gives us enough information to work with. Even with stocks on a tear in the past few weeks, the percentage of bulls fell 6.9 points to 23.7% which is 14.3% below average. That’s right, investors aren’t bullish despite the run. The rally has likely caused investors to be bearish because it feels like stocks shouldn’t be doing this well based on the potential for a record high unemployment rate in the May BLS report. The percentage of bears rose 8.6 points to 52.7% which is 22.2% above average. The current difference between bulls and bears is -29% which is a new bear market low; the trough in March was -21.6%. If you think you are being contrarian by going short on valuation or because the economy is weak, think again! You’re in the majority.
This is the first time the S&P 500 has rallied 10% or more in the prior 7 weeks with more than half of investors bearish. The only similar scenarios are when stocks rallied 10% or more and over 40% were bearish in December 1990 and April 2009.
Keep in mind that the internet stocks are driving the market higher. The CLOU cloud ETF is up 23.09% in the past month. Many of these cloud stocks are being thought of as defensive. That’s because they do well in the work from home environment. It’s weird to think of a high growth stock with no profits as defensive, but that’s been the trade. The fact that these are up so much signals bearishness on the economy. Similarly, the weakness in consumer discretionary excluding Amazon, and energy show investors aren’t optimistic on a turnaround (V-shaped recovery).
Big Companies Aren’t Too Big
The current fear is the big tech stocks are too big. The top 5 biggest stocks are the biggest in modern history, but not the biggest ever. The top 5 stocks are 21.4% of the S&P 500 and are bigger than the bottom 350 firms combined. At least they all have strong moats and relatively reasonable valuations compared to the tech bubble. Despite this, investors get worried they are buying into a bubble. If energy stocks do well and tech stocks fall, it’s a huge negative for the index because energy has gotten so small as a percentage of the index.
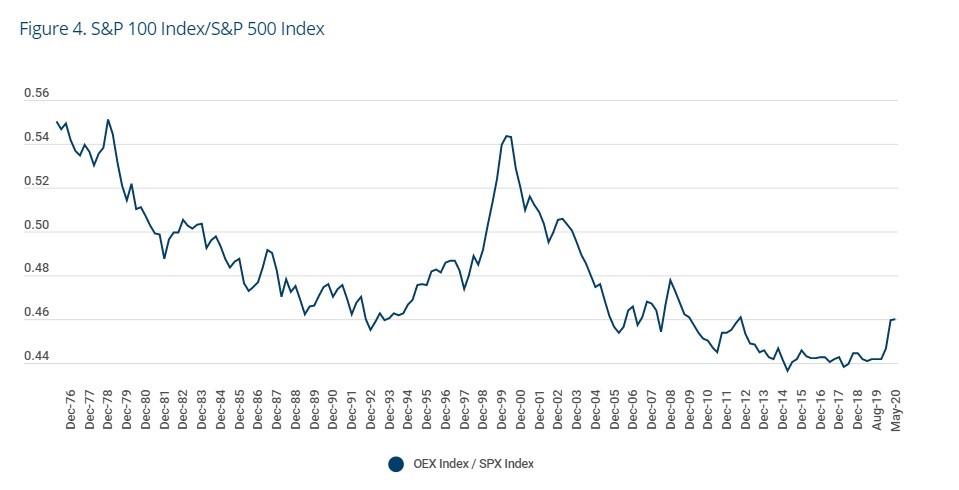
While all of what we said is true, the chart below should put you at ease at least somewhat.
The ratio of the S&P 100 to the S&P 500 is below the historical average. As you can see from the chart above, it’s now at 0.46 which is much below the tech bubble peak of 0.54 when the top 100 stocks largely consisted of new internet stocks. The trade in cloud stocks is a combination of these firms actually doing well because of the circumstances and investors hiding out from cyclical names. This strong rally in the past few months is nowhere near the tech bubble.
Buybacks Are Being Suspended
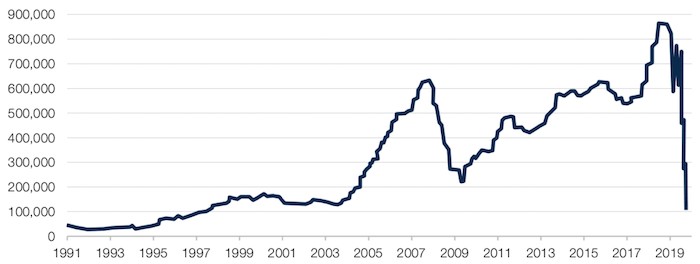
Stocks haven’t done that badly this year when you consider the recession and subsequent decline in buybacks. The number one buyer of stocks is greatly diminished, yet stocks aren’t even down that much. Year to date, there have been $132 billion in buybacks which is below the 3 year average of about $300 billion (as of this point in the year). Goldman predicts 2020 buybacks will be $371 billion which is half of the $730 billion firms spent last year. The chart below shows the massive decline in U.S. gross aggregate buybacks in millions of dollars.
As you can see from the chart below, the financials have accounted for 36% of the canceled buybacks this year, while consumer staples, healthcare, tech, and communications services have only combined for 23% of the buyback cuts.
Apple made the smart move to buyback an additional $50 billion worth of shares. It’s a huge advantage to have a strong enough balance sheet to buyback stock when prices are low, so the buyback can be the most effective at retiring shares. Buybacks are usually cyclical, but Apple is bucking the trend.
Big Tech=Big Lobby
The big tech companies have become so large that they are being scrutinized by officials. Amazon’s massive share of online retail is considered by some to be a monopoly as the share online retail has as a percentage of total consumption rises. Online has spiked to an almost 30% share of retail recently because of COVID-19. It is at 37% in China. China has been higher partially because it developed along with the internet, meaning it skipped the step where retail was built out in the previous century.
In response to this growing risk, the big tech firms are spending a ton on lobbying in Washington. Amazon spent $4.53 million on lobbying in Q1 which was up 2% from last quarter and was a record high. Amazon was the biggest spender in 2019 (16.79 million). Facebook spent $5.26 million on lobbying in Q1 which was up 19% quarterly and a record. Facebook was the second biggest spender in 2019 ($16.71 million) as it was even ahead of the defense contractors. Alphabet spent $2.03 million in Q1 which was down 32% quarterly. It was the 9th highest spender last year at $12.66 million. Apple spent $2.16 million in Q1 which was up 14% quarterly and a new record; it only spent $7.41 million in 2019. Finally, Microsoft spent $2.42 million in Q1 which was up 0.2%. Unlike the others, its lobbying sending peaked in 2013.
Conclusion
Investors are bearish according to the AAII investor sentiment survey. The stock market is climbing the wall of worry which is bullish. The tech stocks are big, but the top 100 aren’t big relative to the top 500. Buybacks are falling sharply largely because of the financials. The big tech firms are spending a lot on lobbying.
Have comments? Join the conversation on Twitter.
Disclaimer: The content on this site is for general informational and entertainment purposes only and should not be construed as financial advice. You agree that any decision you make will be based upon an independent investigation by a certified professional. Please read full disclaimer and privacy policy before reading any of our content.


