UPFINA's Mission: The pursuit of truth in finance and economics to form an unbiased view of current events in order to understand human action, its causes and effects. Read about us and our mission here.
Reading Time: 5 minutes
There were 3 labor reports released on September 5th which was the day before the BLS report was released. The BLS report is followed the most, but some question its validity because of its sometimes massive revisions which can occur in the following months or years. We like to follow all the data and pick out what’s most interesting. Of the three reports, two were positive and one was weak.
Jobless claims were steadily low again as they increased 1,000 to 217,000 in the week of August 31st. That’s the 100th straight week of claims being below 250,000 which is a new record long streak. Claims historically have one of the highest correlations with stock market performance out of any economic metric, so follow them closely.
Small Business Job Creation Regains Its Form
The ADP private sector job creation report showed 195,000 jobs added in August which beat the high end of the estimate range which was 160,000 and the consensus which was 150,000. We consider this report a win because it beat estimates more than the July report was revised lower. July’s reading was revised down 14,000 to 142,000.
The key takeaway from this report is that small business job creation was solid. Earlier in the year, bearish investors highlighted job losses at small businesses as a problem. They were worth monitoring, but not reacting to because 2-3 reports don’t make a trend. Specifically, in May small firms lost 34,000 jobs and in June they lost 11,000 jobs. Finally, in August they regained their stature by adding 66,000 jobs. As usual, education and healthcare drove job creation as it added 58,000 jobs. This isn’t a cyclical group, which is important. The labor market isn’t being driven by cyclical industries which might make it somewhat resistant to a downturn in growth. The economy has already survived 2 slowdowns in this expansion.
Tariffs Cause Spike In Job Cuts
The one negative report was the increase in job cuts in the Challenger Job Cut report. Job cuts increased from 38,845 in July to 53,480 in August. That’s compared to only 25,000 announced hirings. The most interesting part of this report is the 10,488 job cuts catalyzed by “trade difficulties.” That’s a tangible impact of the trade war for those who say it’s not an issue. The good news is shown in the chart below.
The spikes in job cut growth recently haven’t been as bad as the spikes earlier in the year. Therefore, the 6 month moving average of yearly growth fell again. Since it forecasted the slowdown, maybe this is forecasting an end to the economic weakness.
The table below shows the industries with the largest jumps in job cuts.
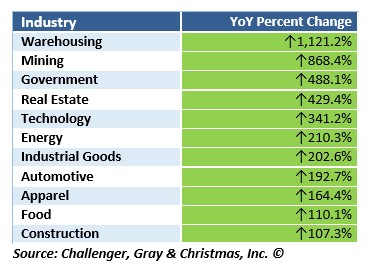
It’s interesting that there was a 193% jump in job cuts in the auto industry even though in August there were 16.97 million vehicles sold which was an increase from 16.8 million. This increase in job cuts is consistent with the findings in the Markit report. The death of retail was greatly exaggerated because warehousing jobs replaced them. The jobs won’t be truly gone until robots replace warehouse jobs. In August there was a 1,121% spike in yearly job cut growth in warehousing. This was the result of warehouses losing contracts with retailers and online stores as well as competition.
ISM Non-Manufacturing PMI Beats Estimates
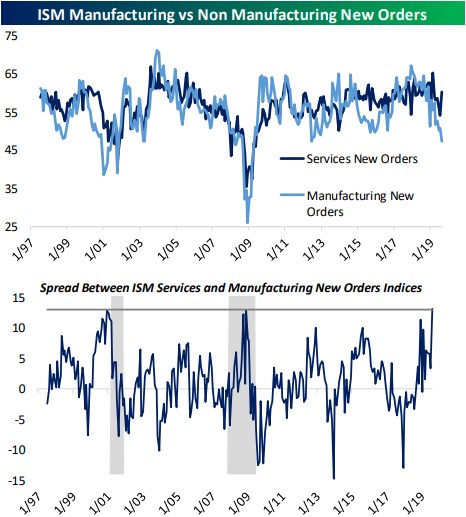
The ISM non-manufacturing PMI improved 2.7 points in August to 56.4. This beat estimates for 54 and the high end of the estimate range which was 54.5. This improvement more than counteracts the weakness in manufacturing because the service sector is much larger. As you can see from the chart below, an 80% services weighting and a 20% manufacturing weighting is correlated with yearly GDP growth. These latest reports imply yearly GDP growth of 2%-2.5%.
The details of this report were solid. The PMI was below its 1 year average of 57.4 and is consistent with quarterly GDP growth of 2.7% which is above the consensus of 2%. Business activity increased 8.4 points to 61.5. New orders were up 6.2 points to 60.3. Even in this great report, the new export orders index fell 3 points to 50.5. That might be because of the trade war. Three of the nine quotes in the report mentioned tariffs. A construction firm stated, “Lower mortgage rates have not had a great effect on new residential construction sales. Tariffs continue to apply upward cost pressures to current supply chains.” It’s interesting to see the huge decline in mortgage rates not helping this construction firm’s business.
We explained how a good services PMI cancels out a weak manufacturing PMI. Not so says the Bespoke charts below.
The past two times the difference between services new orders and manufacturing new orders was this large, the economy was either about to enter a recession or in a recession. Manufacturing weakness led services weakness in the past two recessions. It’s more cyclical so it leads recessions. However, it also gives off false recession signals.
Was The Service Sector Even Strong
In the US, the ISM PMI gets much more coverage than the Markit report. However, don’t ignore it. As you can see from the chart below, the Markit services PMI had a sharp decline unlike the sharp increase in the ISM report.
The Markit services PMI fell from 53 to 50.3 which is the weakest reading since early 2016. New business expansion was the weakest since March 2016. Input prices fell for the first time in series history. Service firms cut selling prices the most since at least October 2009.
Business expectations fell to the lowest in history. Job creation was the weakest since February 2010. The rate of decline in backlogs was the highest since June 2016. The services PMI pushed the composite index down from 52.6 to 50.7, meaning the economy is very close to a recession. This August report is consistent with 1% GDP growth, which means the PMI sees 1.5% Q3 GDP growth (because July’s reading was stronger).
Conclusion
There was a weak Job Cuts report, a strong jobless claims report, a strong ADP report, a strong ISM PMI, and a weak Markit PMI. It’s generally understood that the labor market is strong, but it is seeing a slowdown in growth partially because it is nearly full. We’ve seen some bearish investors claim a great non-manufacturing ISM report doesn’t matter because the manufacturing ISM PMI was weak. A far better argument is to review the Markit PMI which almost indicates a recession. The composite PMI was the weakest since March 2016.
Have comments? Join the conversation on Twitter.
Disclaimer: The content on this site is for general informational and entertainment purposes only and should not be construed as financial advice. You agree that any decision you make will be based upon an independent investigation by a certified professional. Please read full disclaimer and privacy policy before reading any of our content.


