UPFINA's Mission: The pursuit of truth in finance and economics to form an unbiased view of current events in order to understand human action, its causes and effects. Read about us and our mission here.
Reading Time: 4 minutes
The June labor report was very strong. We will review it in this article. However, we can’t ignore the recent weakening in the data in the 2nd half of June which the labor report doesn’t capture. The ADP private sector payrolls report showed there were 2.369 million jobs added of which 937,000 were created by small firms. The chart below shows the small business pulse survey saw a change in the trend in the last 2 weeks of the month. July monthly data could be worse than June. The percentage of small firms saying hours worked increased fell from 13.1% to 11% in the final 2 weeks of June. The percentage reporting an increase in paid employment fell from 10.2% to 8.9%.
This along with the weak jobless claims reports signal a potential trend change. That could be why stocks didn’t rally much following the great June BLS report on Thursday. The counter argument is that was the 4th day in a row stocks were up, so they may have already priced in strength. However, that might be incorrect because stocks were up more in the pre-markets before the labor report came out than where they closed the day at.
Fantastic June Labor Report
The June labor report was a continuation of the theme of reopenings allowing people to get their jobs back. There were 4.8 million jobs created. In our Twitter poll, only 26.7% of 75 followers said there would be over 4 million jobs created. This was clearly an upside surprise as the consensus among economists was 3 million. Furthermore, the May report was revised to show 2.699 million jobs added instead of 2.509 million.
The chart above shows the job losses in the downturn far outweigh the number added back in the past 2 months. The net difference is still -14.7 million jobs. On the positive side, the unemployment rate fell from 12.4% to 11.1%; that’s even with the misclassification gap falling. As we mentioned, with the added protocols, we expected the number of people misclassified as employed to fall sharply. The adjusted for misclassification unemployment rate fell from 16.4% to 12.3%. In other words, the actual improvement was even better than the headline rate indicates. In next month’s report, misclassification will probably shrink to such a small level it’s not worth mentioning. The U6 underemployment rate fell from 21.2% to 18% which is bay far the biggest decline in history (going back to 1994).
‘Permanent’ Job Loss Increases
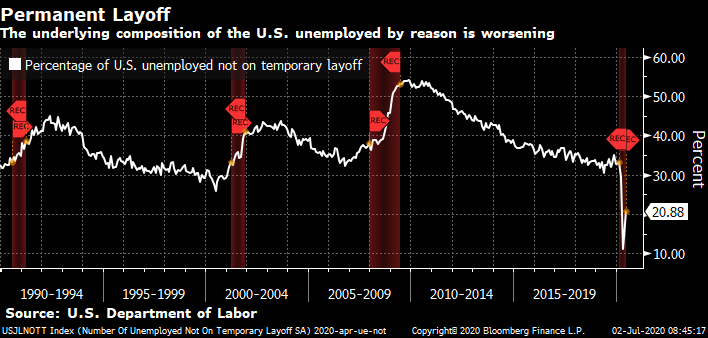
‘Permanent’ job loss is when the relationship between the employee and worker is severed. The employer likely eliminated the position causing the ex-employee to need to find a new place to work. As you can see from the chart below, usually the percentage of unemployed workers not on temporary layoff increases in recessions. It fell sharply in this recession because this was an unusual one where most job losses were only temporary. People couldn’t go to work because of the virus. The worry during the worst of the recession was that many of these jobs wouldn’t come back.
Eventually, there will be new jobs created in the next few years, but obviously that’s not as simple as just bringing people back. The percentage not on temporary layoff is 20.88% (about double from the recessionary bottom) which looks low on a historical basis. However, the unemployment rate is still higher than the peak of the last recession, so on an absolute basis it’s high. Specifically, there were 588,000 more ‘permanent’ job losses which brought the total to 2.9 million. The theory with ending the $600 federal unemployment benefit program is people need to be incentivized to work. However, at least 2.9 million people won’t be able to easily find a job once their benefits run out on July 25th.
Jobs By Industry
Leisure and hospitality gained the most jobs as it added 2.1 million. Next were retail with 740,000; healthcare with 475,000; and manufacturing with 360,000. Remember, Texas recently started delaying elective procedures which hurts the healthcare industry. The June ISM manufacturing PMI bounced back considerably which is a good sign. Even though leisure and hospitality added the most jobs, its employment is still down the most since before the recession as there are 28.6% fewer jobs in the industry. Information services, which pays the most, has 10.9% fewer jobs. Retail only has 8.1% fewer jobs. That’s because supermarkets and other necessary stores are included. Employment at clothing stores increased 202,000 in June, but it’s still down 40% from last year.
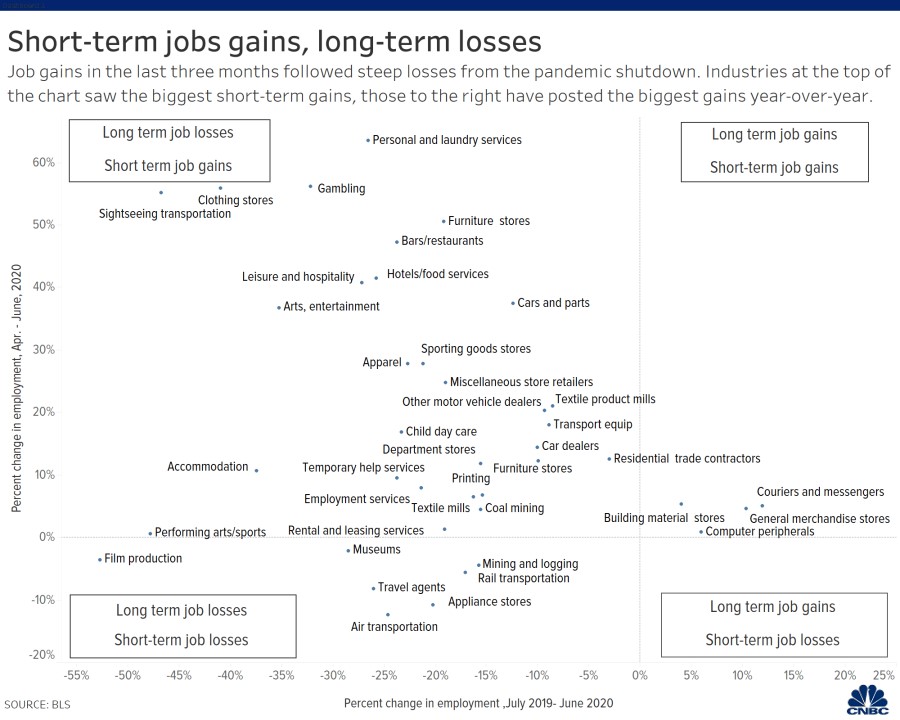
The CNBC chart below breaks down each industry in terms of short and long term job losses/gains. As you can see, clothing stores are in the long term job losses and short term gains category. Unfortunately, zero industries are in the short term loss and long term gain category. Only 4 are in long term gains at all with couriers and messengers experiencing the most long term gains. 36 industries have long term losses.
The labor force participation rate rose from 60.8% to 61.5% which beat estimates for 61.1%. It’s still way below where it was before this recession (63.4%). The prime age labor force participation rate rose from 80.7% to 81.5%. That’s the exact same percentage increase as last month despite their being over 2 million more jobs created. It’s still below the pre-recessionary level which was 83%.
The average work week fell from 34.7 hours to 34.5 hours. The May reading was actually the highest ever probably because essential workers were working longer hours. Hourly wage growth fell from 6.7% to 5% as many of the workers that came back to their jobs were in low paid industries. This missed estimates for 5.3% growth. Because of the decline in hourly wages and hours worked, weekly earnings growth fell sharply from 7.6% to 5.3%. Obviously, the goal is to get people working again before we worry about the size of paychecks.
Conclusion
There are a few early warning signs which suggest the economy fell backwards in the 2nd half of June despite the great June jobs report. There were 4.8 million jobs added which is a fantastic reading. It pushed the adjusted for misclassification unemployment rate down 3.9%. The increase in ‘permanent’ job losses was concerning. When the federal unemployment benefits expire, 2.9 million people won’t immediately be able to go back to work. Only 4 industries are experiencing long term job gains. That’s compared to 36 experiencing long term losses.
Have comments? Join the conversation on Twitter.
Disclaimer: The content on this site is for general informational and entertainment purposes only and should not be construed as financial advice. You agree that any decision you make will be based upon an independent investigation by a certified professional. Please read full disclaimer and privacy policy before reading any of our content.


