UPFINA's Mission: The pursuit of truth in finance and economics to form an unbiased view of current events in order to understand human action, its causes and effects. Read about us and our mission here.
Reading Time: 4 minutes
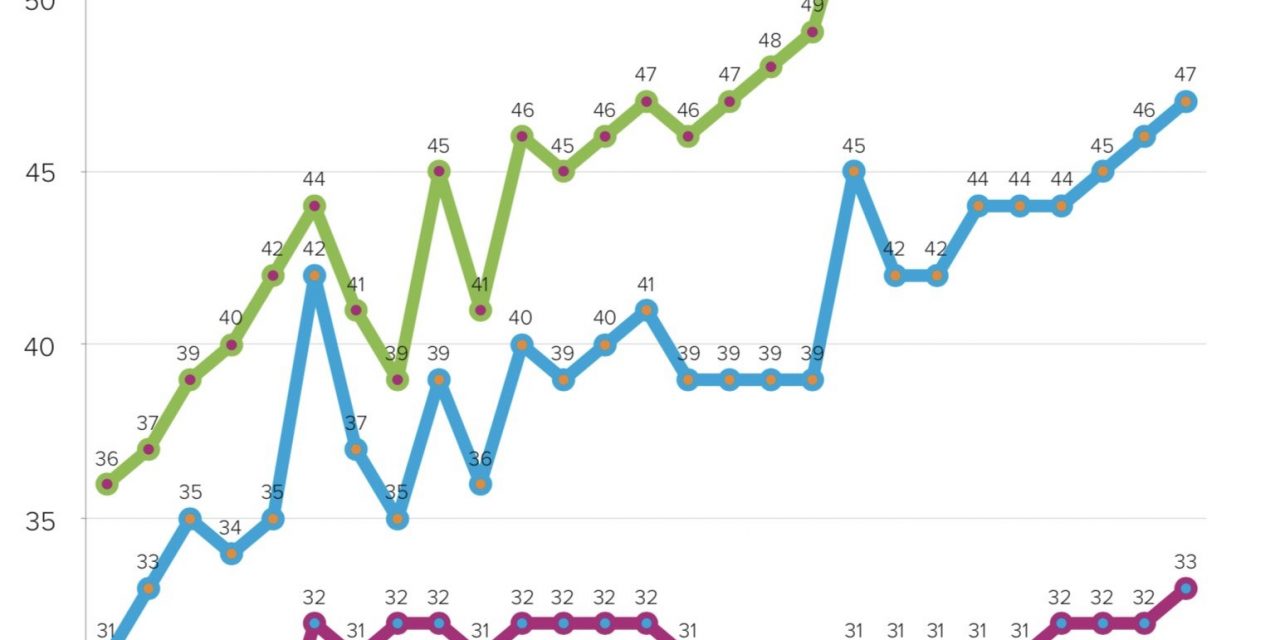
The median home buyer has gotten older because millennials are putting off home buying because of student loans and because they are getting married later (partially because women are working more). The median buyer has also gotten older because of demographics. Baby boomers are repeat buyers. We want to adjust for boomers who are repeat buyers to see the actual changes for millennials. The data can look dire if you include all buyers because it makes it look like millennials aren’t buying houses. That’s not true. The homeownership rate for those under 35 years old was 37.5% in Q3 2019; that’s up from the bottom of 34.1% in Q2 2016.
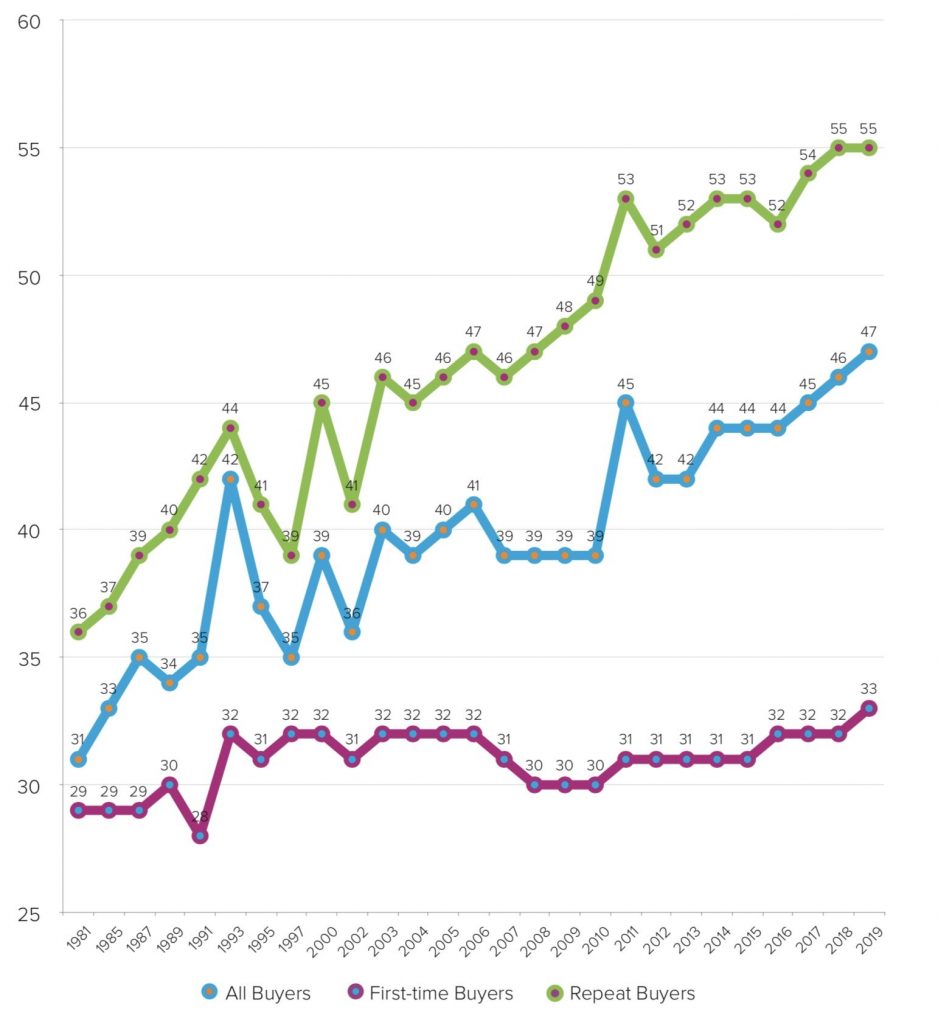
Millennials have modestly delayed buying. The blue line in the chart above shows the disheartening figure which is misleading. The median buyer in 1981 was 31 and it was 47 in 2019. It increased 8 years since the financial crisis. This is mostly driven by repeat buyers which is shown in the blue line. The median age of first-time buyers actually isn’t up that much. It was 29 in 1981 and now it’s 33. It’s more interesting that even in this expansion, the average age has increased 3 years. The most common ages in America are in the late 20s which means the largest part of the millennial generation is planning to buy their first home.
Job Cuts Fall
The November job cut report was more of the same. Job cut announcements spiked in Q4 2018 and Q1 2019. As the year has gone on, it has become clearer that there is no indicator of distress in the labor market. As you can see from the chart below, the 6 month average of yearly growth has gone negative after it was about 70% in early 2019.
In November, job cuts fell from 50,275 to 44,559. That’s a 16% decline from last year which explains why the 6 month average went negative.
Total 2019 cuts have been 559,713 which is up 13.1% from the first 11 months in 2018. That’s because of the Q1 spike we discussed. The tech sector has had the biggest jump in cuts on a percentage basis this year. Tech job cuts are up 379.9% to 63,447. That’s the 3rd largest total cuts. The South has had the biggest jump in job cuts by far in 2019 as cuts are up 50.9% to 120,795. This increase was driven by Virginia which has had 24,948 cuts which is up from 9,357 in the first 11 months of 2018. Finally, there were 19,063 hiring announcements in November which is down from 190,835 in October (seasonality) and up from 15,422 last year. Total hiring announcements in 2019 were 1.18 million which is already up from 1.02 million in 2018 even without the last month of data.
Jobless Claims Hit 3rd Lowest Reading Of Expansion
Potentially because of the late Thanksgiving, seasonally adjusted jobless claims fell from 213,000 to 203,000 in the week of November 30th. That’s a decline of 25,000 in the past 2 weeks. The 4 week average only fell from 219,750 to 217,750 because of the bump up in the 2 weeks prior to this big decline. Therefore, the average will quickly fall in the next 2 weeks if the weekly reading stays this low. This was the 3rd lowest weekly reading of the cycle. As you can see from the chart below, non-seasonally adjusted claims fell over 100,000 year over year for the first time since 2013. This is obviously because of the timing of Thanksgiving. Either the seasonal adjustment didn’t fully adjust the data or the labor market got better in addition to the seasonal improvement.
Services Index Increases In ISM PMI
The ADP report showed weakness in private sector job creation, but the recent jobless claims, jobs cuts, and ISM employment index have all been strong. The tiebreaker is the monthly BLS report which we will discuss in a future article. As you can see from the chart below, the employment index increased 1.8 to 55.5 even as the overall PMI fell as we will get to next.
Note that the service sector is responsible for most job creation and that this index has increased twice in a row after bottoming in September. It’s the highest reading since July.
ISM Services PMI Falls
Just like the manufacturing sector, the ISM services PMI fell and the Markit PMI rose. The difference here is the services ISM PMI is higher than the Markit PMI. As you can see from the chart below, the services ISM PMI fell 0.8 to 53.9.
You can see the 3 manufacturing slowdowns which weren’t coincident with service sector PMIs below 50 which is why they didn’t become recessions. This decline put the composite PMI at 53.3 which is slightly below the long term average of 54.4. It’s above its recent bottom of 52.1. It fell below the long term average in each of the 3 slowdowns in this expansion.
This services PMI is consistent with 1.9% GDP growth which is slightly below the Atlanta Fed Nowcast which is 2%. Using that framework, this was an ok report. The weakest segment was business activity which fell 5.4 points to 51.6. Nine industries had business activity growth and 7 had a decline in activity. The new orders index was up 1.5 to 57.1. Along with the increase in the employment reading we mentioned earlier, it’s safe to say this report was a mixed bag.
In the comments section, 3 of the 9 firms quoted mentioned the trade war or tariffs. A professional, scientific, and technical services firm stated, “We’re optimistic [because the] economy appears to be on autopilot, despite all the political distractions. Stock market seems invincible, trade war with China appears to be in a stalemate. Job growth appears to be reaching an equilibrium point. Final economic demand appears strong, with positive spend forecast for the holidays.” An autopilot economy isn’t consistent with the calls for a recession. The labor market’s job creation has still been strong, but there’s not much slack left as the unemployment rate is low and the prime age labor force participation rate is high.
Conclusion
The median age of first time buyers isn’t up as dramatically as the median age of all buyers. Most labor reports have been strong except for the ADP report. The ISM services PMI fell unlike the Markit PMI, but it is above the Markit PMI and is consistent with 1.9% GDP growth.
Have comments? Join the conversation on Twitter.
Disclaimer: The content on this site is for general informational and entertainment purposes only and should not be construed as financial advice. You agree that any decision you make will be based upon an independent investigation by a certified professional. Please read full disclaimer and privacy policy before reading any of our content.


